Filters
Filters are used in reports, bill lists, and dashboard widgets to narrow or broaden the reporting scope.
If you create conflicting filters you may not receive any results. Remember filters use the concept of and not or, meaning the results match all the configured filters.
Filter options–string
This filter option is available with meter, place, account, and vendor.

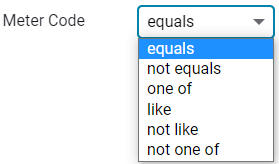
equals or not equals
Use your mouse to select the option you want.
one of
This option lets you add several objects. Click in the box to select one or more items.
like or not like
Type in a partial string, any objects containing this string are selected or not selected. Wildcards aren't supported.
not one of
Choose several objects from the drop-down. These objects are not included in the returned data.
Account is active
- The default is Active.
- Choose Inactive if you are running historical reports to get billing information for inactive accounts.
- Remove the filter to have all utility bill information including both active and inactive accounts.
Base year begins
Set the year to compare against.
Bill is from external vendor
This filter can be helpful if you use chargebacks.
- From External Vendor–only bills from external vendors are included.
- From Internal Chargeback–only bills created within UtilityManagement using the chargebacks processor.
- Filter not used–includes all bills (both internal and external).
Date range
Define the reporting period for the displayed data.
Take advantage of automatically updated time periods such as prior year or year-to-date. This automatically updates the date range for you.
Bill is void
The default is Not Void.
For example, choose Void if you want to see how often your vendor is correcting bills.
Site group
- Rather than select a topmost place, a site group (or meter group) can be used as a filter. These groups can be automatic groups with membership maintained by the application or manual groups with membership maintained by you.
- Groups are a powerful filter option and can be useful when the tree structure doesn’t meet your reporting needs.
Commodity
Choose the commodity.
Use units are shown in the global unit of measure (typically MMBTU) when there are multiple commodities.
Line charts
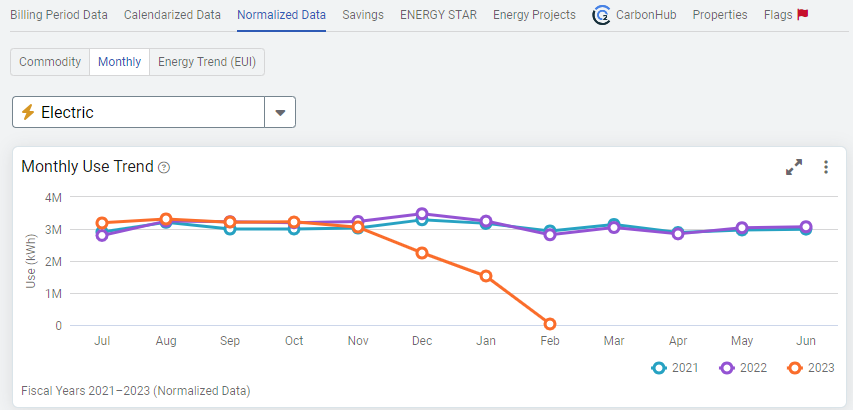
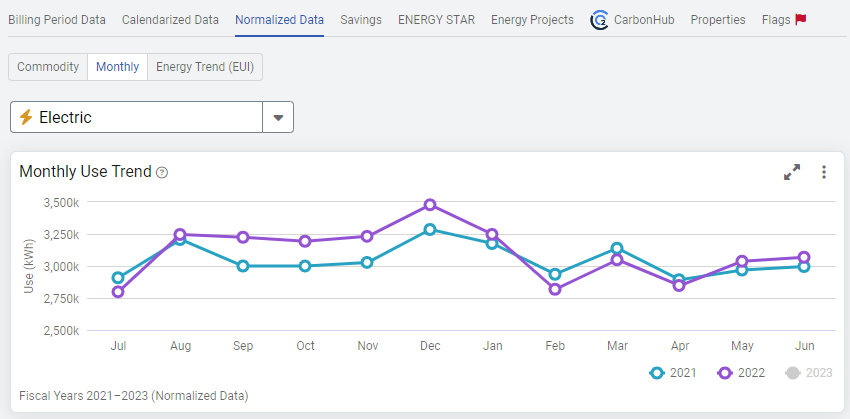
You can remove years from your chart by clicking in the legend.


Data displayed
Billing Period Data–Billing period data uses the raw billing data as received from the utility vendor. Billing period data is better when working with accounting functions or charging departments for their portion of a bill.
Calendarized–Is more representative of monthly use and cost. For year-over-year comparisons, use calendarized data.
Normalized–Is best when comparing USE year-over-year because it removes weather as a variable.
Group by
Determines what is shown on each page of a report.
For example, Commodity gives a high-level overview, Cost Center is useful for Accounting and Place Type - Building lets you analyze data on a building by building basis.
Topmost filter
Use the topmost filter to set the topmost place or cost center for reporting. This can narrow your focus, as it limits the returned data to objects under the specified node of the tree.
When choosing a topmost filter, the first 250 results are listed in the drop-down. To shorten the list type several letters of the object you are searching for.
Setting a topmost filter is particularly useful if chargebacks are implemented for your organization. Chargebacks use a node in the tree that may be named Supporting Data – NOT FOR REPORTING. Do not include this node in your report or dashboard because the results double count use and cost.