Formula Composer
The Formula Composer helps you move from working in spreadsheets to a fully flexible analysis of business and energy data at the click of a button, This makes your reporting better, quicker, and easier to manage.
Check out the Formula Composer video.
With formula meters, you can combine multiple data sets including data points, and constants all within one data point. For example, calculating energy usage within a certain time of day.
Steps to create a formula
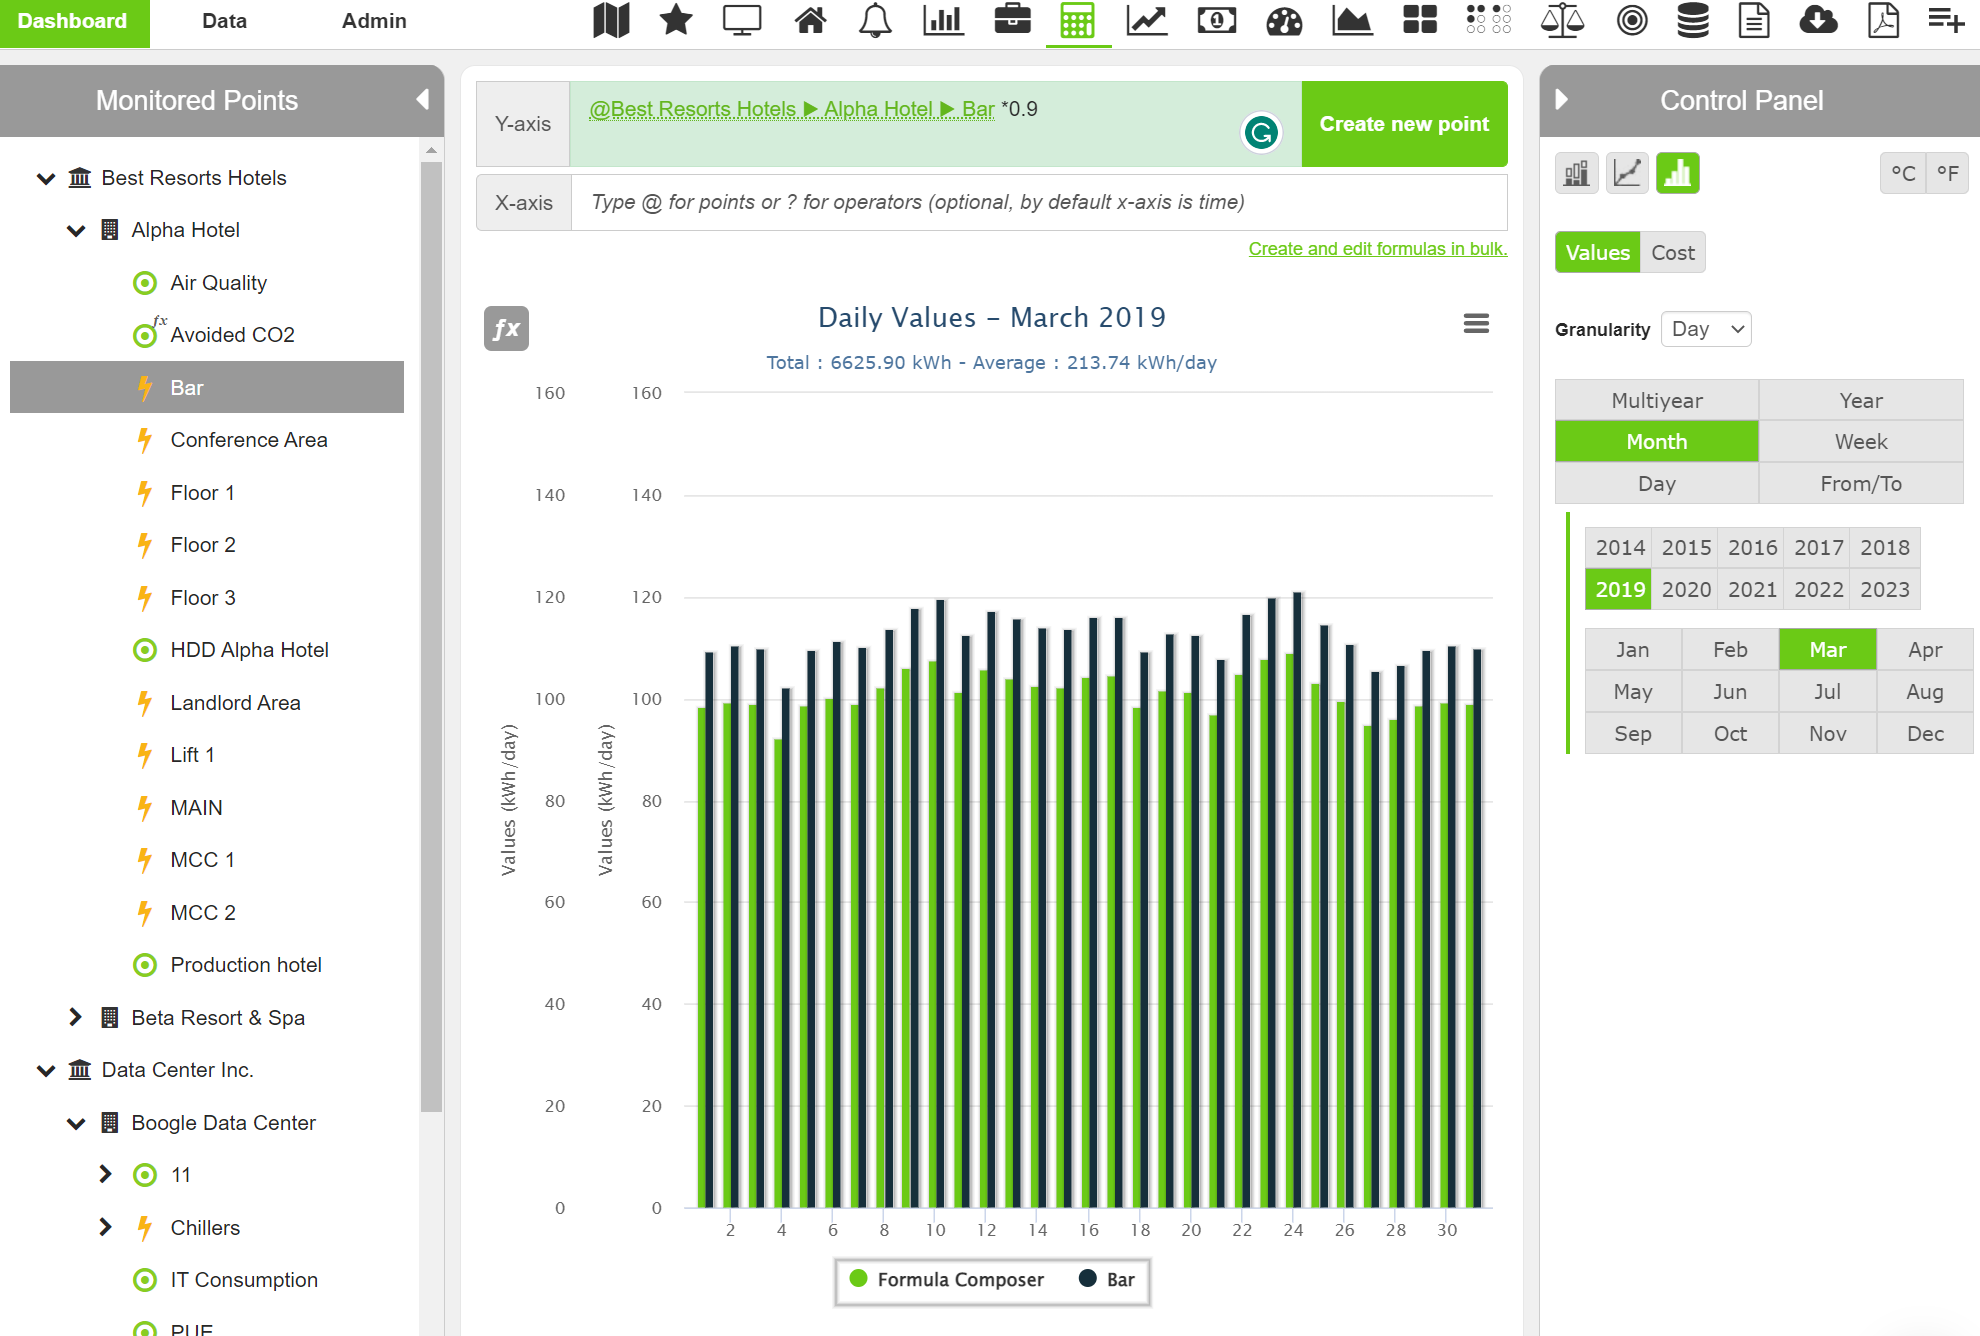
Click on the calculator icon in the toolbar.
In the top field, you can type a formula and immediately see the result of the calculation in the graph. If you want to keep the formula you can save the formula and it becomes a data point.
Use the @ to find a data point and the ? to list the operators.
Formulas are applied to the lowest common granularity that is available. While you can preview and apply the formula at any granularity, when you save the formula it is applied at the lowest common granularity of the referenced data streams.
For example, when combing two data points, one with hourly interval data and the other with five-minute interval data, the formula data point is hourly.
In this example, you can see the data points plotted for your formula in green and the actual data plotted in black. This could help you compare your actual production figures against your calculations.
If you were trying to reduce your use by 10% this gives you an idea of what it looks like.
Apply formula to historical data
You can also save the formula as a new data point and apply the calculation to historical data, without saving the formula it is only applied to the time period you select. As new data enters the system the formula continues to calculate. You can select the date for when to start calculating and optionally you can select the end date.
When you save the new formula data point it becomes a data point in your tree that can be used for reports, notifications, Sentinel trends, breakdown saving performance, and tracking.
Regression analysis
In this example we are comparing a formula to a formula, to determine if there is a correlation between the two.
If there is a weak correlation there could be room for improvement in energy management.
For example, is there a correlation between energy consumption and production? If there is a weak correlation there could be room for improvement.
Edit formula meters in bulk
You can edit a single formula or edit formula meters in bulk with the Create and edit formulas in bulk option. Here you can access all your formulas and create new formulas.
When you edit a meter the data is deleted and recalculated.
Create a formula meter
The possibilities are virtually limitless when it comes to performing calculations for your projects whether its variance between expected kWh and actual kWh for solar PV production, GHG emitted from your buildings/facilities, or creating virtual meters to identify the kWh of other non-monitored equipment.
Let’s walk through an example of creating a formula meter. This section is in two parts.
1. Typing a formula to calculate costs
2. Creating a new point
Using current data points as variables, you can create unique formulas. To compute costs, start by choosing your data point(s) in the left menu tree and applying tariffs and conditions ( for example, +, -, /, *,s >, =, and, or, if-then-else, etc.).
Type a formula to calculate costs
In the first example, we are multiplying the energy consumption of a data point (Hotel leisure center) by a tariff rate (0.12), and add a fixed amount (2) (transportation cost, meter management cost) to the result.
The addition of the tariff rate and operators *0.12 + 2 shows that you can build formulas. This formula in the example could apply if you are paying a fixed amount for each kWh delivered plus the cost of the kWh itself.
The chart shows the result of the calculation as soon as a formula is properly typed, this lets you cross-check that the formula is correct and the results are in line with what’s expected.
When you create the data point you can apply the formula to the cost or the energy, in this example it is energy.
Second example
Here is a more complex example to show the potential of a formula meter.
In the example above we can add an IF clause to replicate the case of an energy distributor that gives different rates depending on the consumption tier. As you can see in the formula, the rate applied changes based on the monitored energy consumption.
If the use of the data point is less than 8, the rate is 0.12, else the rate is 0.15.
Creating a new point
To create a new data point showing cost, click Create new point.
After the new point is created, a form appears.
Complete the form and Save.
The new formula data point appears in the selected position.