Operations Analyzer
The Operations Analyzer lets you understand the usage and wastage of resources. You can simulate turning off devices for a period of time in the day or replacing machines, lights, or appliances for more efficient ones.

Operations Analyzer
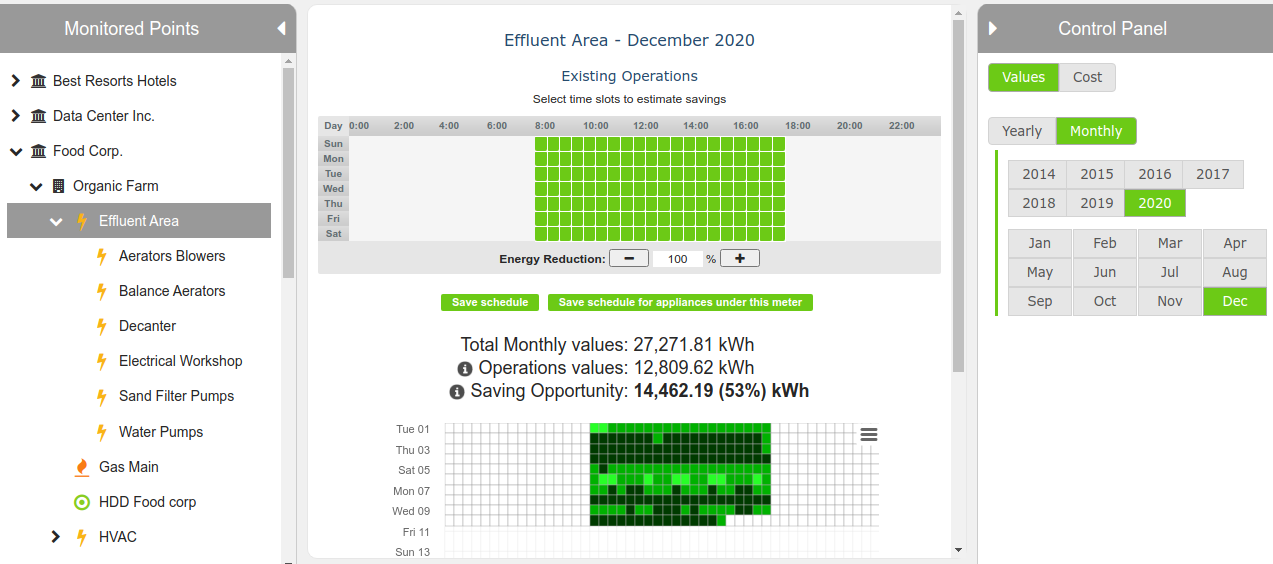
- Select the data points.
- Create a schedule, you can reduce use (blocks show as gray) or completely remove use (time blocks show as white).
- View the different time periods.
- Your savings opportunities are listed in the middle of the page.
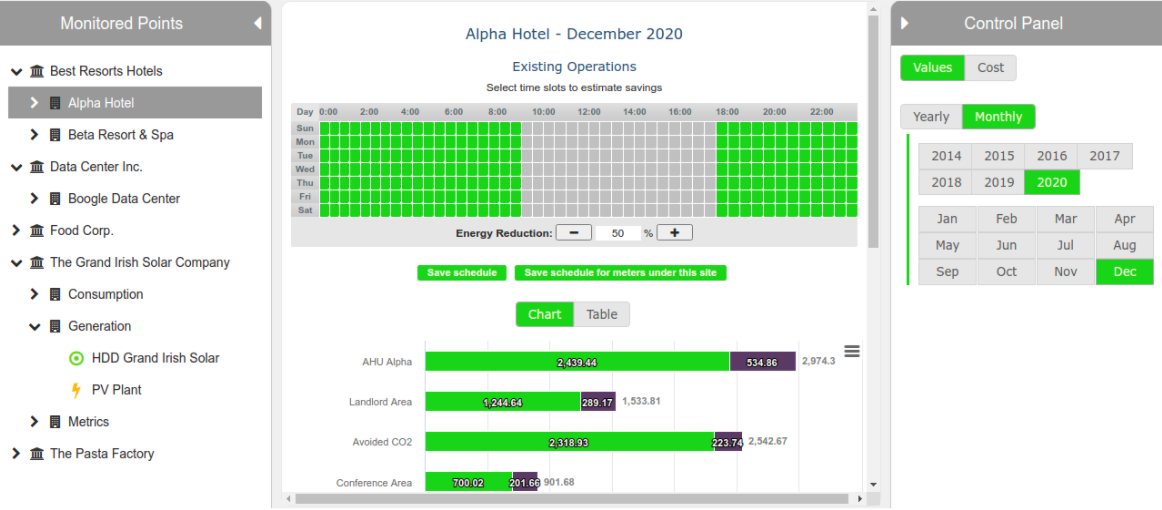
If a site (level 2) is selected, the schedule is applied to all the data points under that site, and a ranking of them is presented. This lets you focus on where the possible saving could be best.
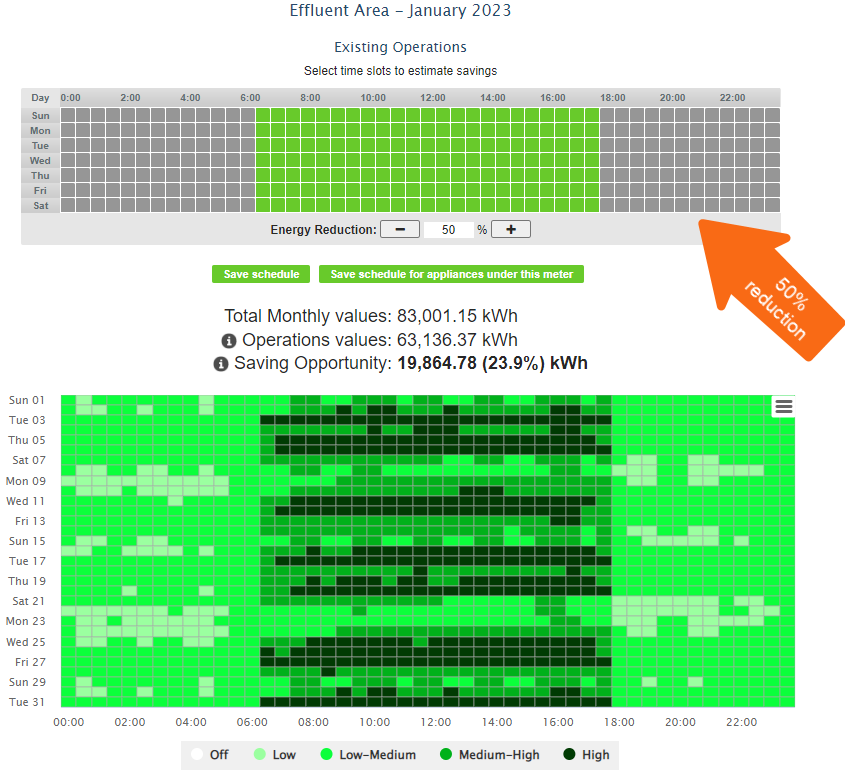
50% Reduction Example
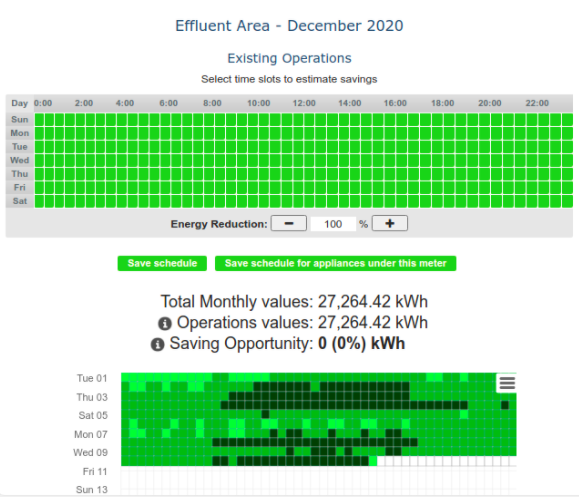
Data Point Example
An example of a schedule for a data point.
In this schedule, we have simulated a turn-off of the data point between 18:00 and 8:00 am. This shows the savings opportunities for this potential schedule change.
Site Example
The same concept applies to the schedule for the site (level 2), but the final result is the ranking of the data points for the site.