Reports
You can schedule and send reports to your team, to your clients, or to yourself by creating report definitions.
Create report definitions in the Admin section.
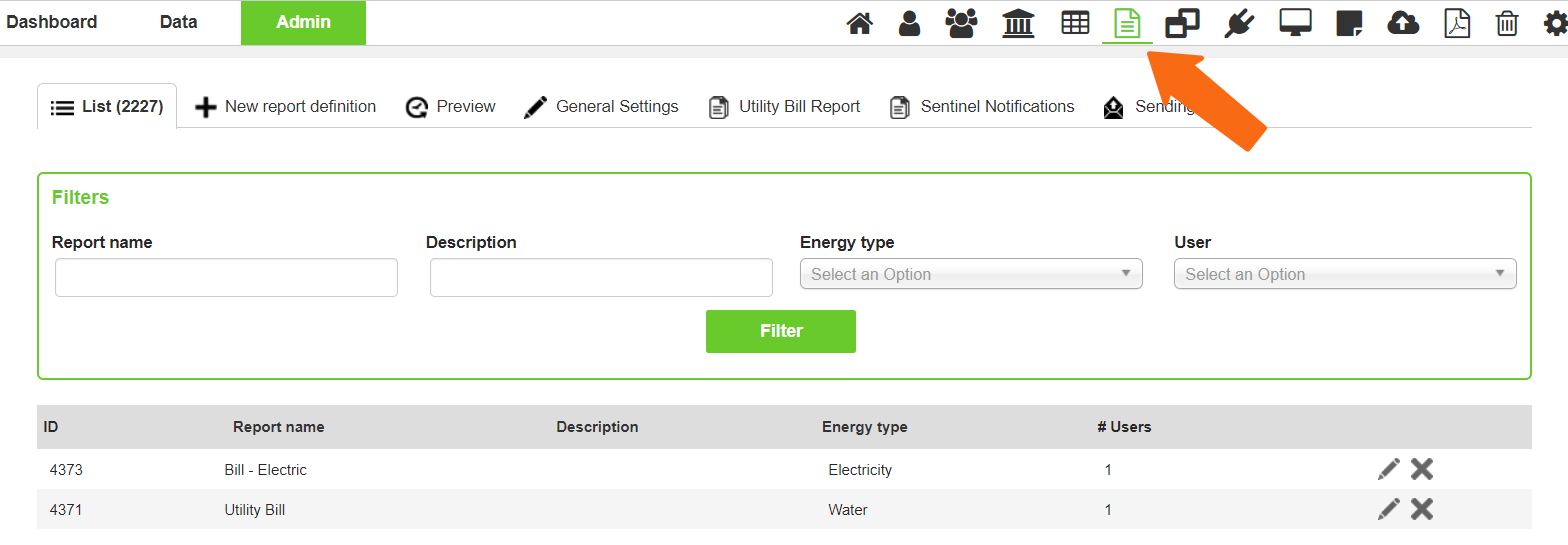
Created report definitions are listed and searchable using the filters at the top of the page. To create a new report definition, select New report definition.
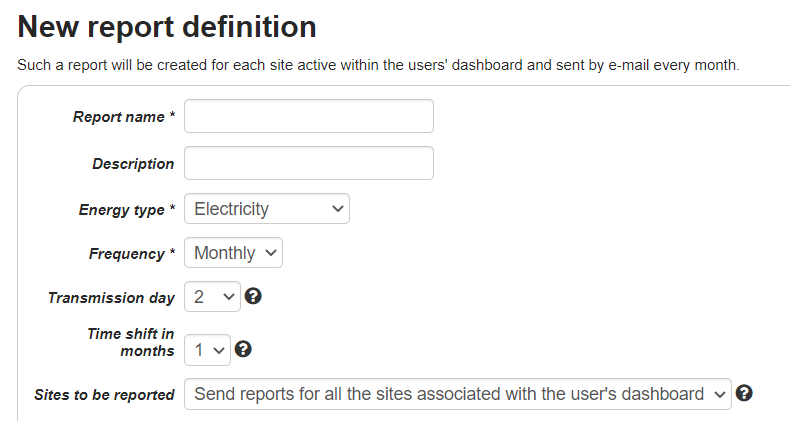
When setting up a new report definition complete the form and select the reports to include.
Reports Overview
Trend analysis
- Monthly consumption, compares to the previous month and the same month in the previous year.
- One page per site.
- Available for electricity and gas.
Trend analysis and compare chart
- Monthly use.
- Daily use bar chart for the month.
- Use compared to previous month and month in previous year.
- Month-to-month comparison with previous year.
- One page per site.
- Available for electricity, water and gas.
Active power and weekdays
- Monthly load demand variations.
- Weekday use breakdown.
- One page per data point. (level 3)
- Available for electricity.
Heatmap and operations analyzer
- Monthly heatmap and waste analysis.
- One page per data point. (level 3)
- Available for electricity.
- You can add comments to the report.
Operations analyzer and weekdays
- Use by day.
- Use breakdown for weekday and weekend.
- One page per data point. (level 3)
- Available for electricity, and gas.
- You can add comments to the report.
Top 3 consuming areas
- Top consumers for a site.
- One page per site.
- Available for electricity.
Top 3 consuming sub-areas
- Top consumers (submeters) for top 3 consuming data points.
- One page per data point.
- Available for electricity.
Deployment
- Highlight data points that are physical meters.
- One page per site.
- Available for electricity and gas.
Energy performance
- Shows normalized data for the eligible data points.
- One data point per page.
- Available for electricity and gas.
Sentinel events
- Total Sentinel events for each monitored data point.
- Calculates cost impacts of events.
- Costs are color coded; green for savings and red for expenses.
- One page per site.
CO₂ emissions analysis
- Monthly CO₂ emissions.
- Emissions compared to previous month and month in the previous year.
- Daily emissions for current and previous month.
- Year-to-year emissions comparison.
- One page per site.
CO₂ monthly trend
- Monthly CO₂ emissions.
- Emissions compared to the previous month and month in the previous year.
- Year-to-year emissions comparison.
- One page per site.
Power quality report
- Reports on Active Power, Reactive Power, Apparent Power, Power Factor, RMS Voltage, and RMS Current.
- One data point (level 3) per page.
Utility data monthly trend
- Month's consumption, compared with the previous month and the same month in the previous year.
- Breakdown consumption per weekday.
- One page per site.
- Available for electricity, water, and gas.
Utility bill
- Utility bill based on use.
- One page per site.
- Available for electricity.
- You can add comments to the report.