Custom benchmarks
Custom benchmarks let you group and rank your site using your own criteria—beyond what's available by default.
Why use them?
They help compare performance across sites based on custom metrics that matter to your organization.
Example
You can create a building-level benchmark such as:
- Occupancy
- Class enrollment
This lets you compare cost and energy use across sites with similar use patterns.
Configure custom benchmarks
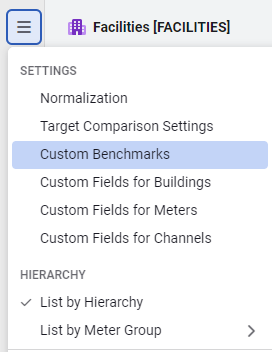
Configure custom benchmarks in the Sites and Meters module menu. Custom benchmarks use calendarized data for reporting.
Steps to create and use custom benchmarks
Create a custom benchmark
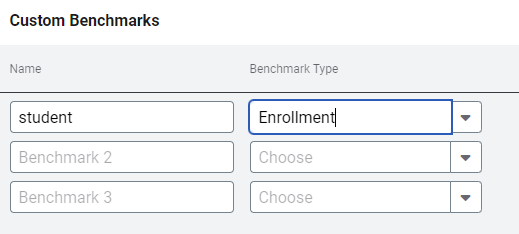
In the Sites and Meters module menu, select Custom Benchmarks. You can add up to three custom benchmarks.
- Enter a name for your benchmark.
- Choose a benchmark type.
Set the values for the custom benchmark
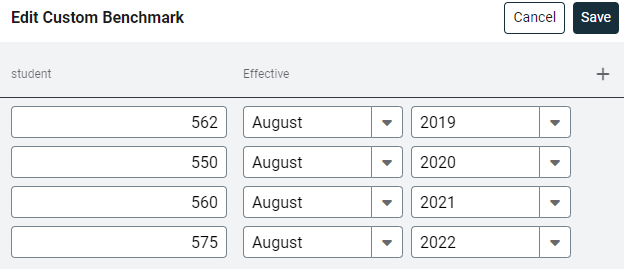
On the site's Properties tab you can enter the values or you can update values for many sites at one time with a spreadsheet.
This example is for one site.
- Enter the value.
- Enter the effective month.
- Enter the effective year.
Now that your custom benchmarks are created and populated, create a group to view the site data in the Groups and Benchmarks module.
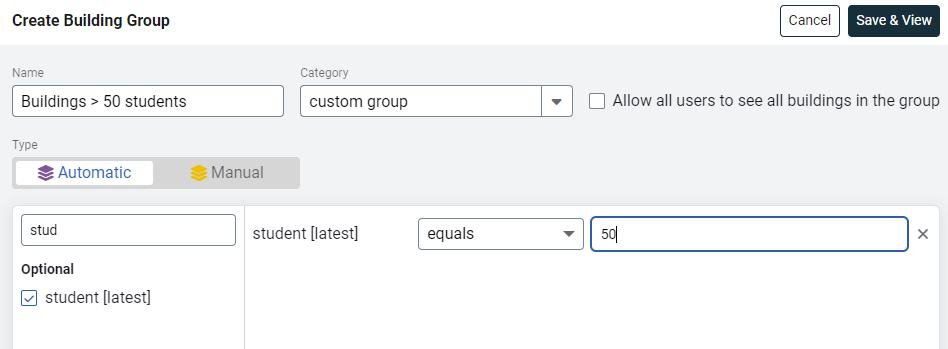
Create the group as normal
In the Groups and Benchmarks module:
- Create the group.
- Add a descriptive name, select a category, and choose the type of group. To use custom benchmarks, choose Automatic and set the filters.
View the group in Groups and Benchmarks module
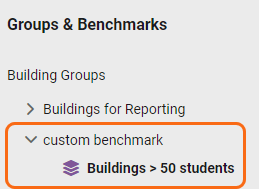
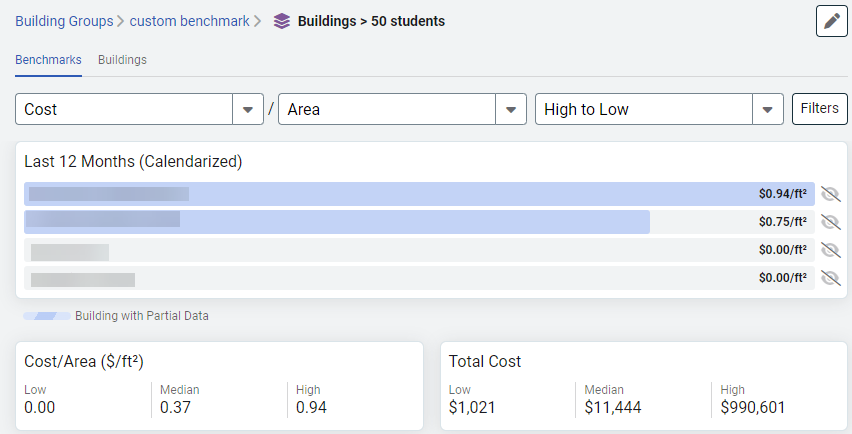
After your group is created you can view the group in the Groups and Benchmarks module.
Open the category you created and click on the group to view details.
New group is also a filter
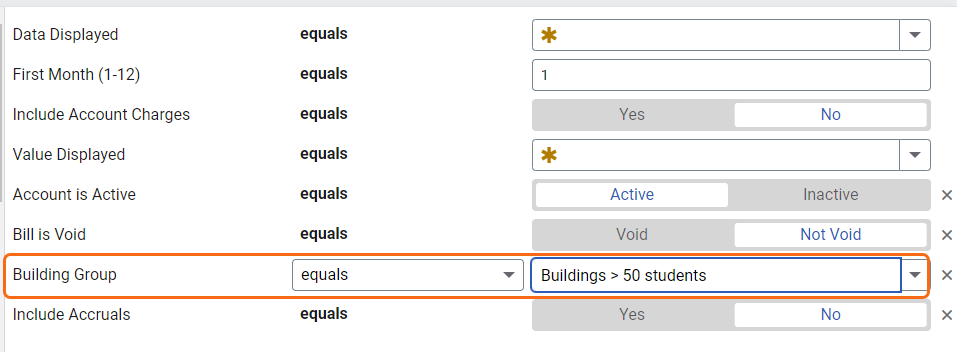
This group is now available as a building group filter in dashboards, reports, and bill lists.
Site calculations versus organizational calculations
Site with a single benchmark entered
A school with $1,000 of utility cost per month with enrollment of 100 students for September 2018 to present.

| Month | Cost | # Students | Cost per Student |
| Jan 2019 | $1,000 | 100 | $10.00 |
| Feb 2019 | $1,000 | 100 | $10.00 |
| Mar 2019 | $1,000 | 100 | $10.00 |
| .... | |||
| Dec 2019 | $1,000 | 100 | $10.00 |
| $120.00 |
Site with multiple benchmarks entered
A school with $1,000 of utility costs per month with enrollment that changes with the new school year.
| Month | Cost | # Students | Cost per Student |
| Jan 2020 | $1,000 | 100 | $10.00 |
| Feb 2020 | $1,000 | 100 | $10.00 |
| Mar 2020 | $1,000 | 100 | $10.00 |
| April 2020 | $1,000 | 100 | $10.00 |
| May 2020 | $1,000 | 100 | $10.00 |
| Jun 2020 | $1,000 | 100 | $10.00 |
| Jul 2020 | $1,000 | 100 | $10.00 |
| Aug 2020 | $1,000 | 100 | $10.00 |
| Sep 2020 | $1,000 | 112 | $8.93 |
| Oct 2020 | $1,000 | 112 | $8.93 |
| Nov 2020 | $1,000 | 112 | $8.93 |
| Dec 2020 | $1,000 | 112 | $8.93 |
| $115.71 |
Organization with multiple sites and values
The calculation used for multiple sites with multiple custom benchmarks is different.
This calculation uses only the most recently entered benchmark data.
| Building | Month | Cost | # Students | Cost per Student |
|
School 1 |
Jan-20 | $1,000 | 100 | $10.00 |
| School 2 | Jan-20 | $2,000 | 150 | $13.33 |
|
School 1 |
Feb-20 | $1,000 | 100 | $10.00 |
| School 2 | Feb-20 | $2,000 | 150 | $13.33 |
|
School 1 |
Mar-20 | $1,000 | 100 | $10.00 |
| School 2 | Mar-20 | $2,000 | 150 | $13.33 |
|
School 1 |
Apr-20 | $1,000 | 100 | $10.00 |
| School 2 | Apr-20 | $2,000 | 150 | $13.33 |
|
School 1 |
May-20 | $1,000 | 100 | $10.00 |
| School 2 | May-20 | $2,000 | 150 | $13.33 |
|
School 1 |
Jun-20 | $1,000 | 100 | $10.00 |
| School 2 | Jun-20 | $2,000 | 150 | $13.33 |
|
School 1 |
Jul-20 | $1,000 | 100 | $10.00 |
| School 2 | Jul-20 | $2,000 | 150 | $13.33 |
|
School 1 |
Aug-20 | $1,000 | 100 | $10.00 |
| School 2 | Aug-20 | $2,000 | 150 | $13.33 |
|
School 1 |
Sep-20 | $1,000 | 112 | $8.93 |
| School 2 | Sep-20 | $2,000 | 175 | $11.43 |
|
School 1 |
Oct-20 | $1,000 | 112 | $8.93 |
| School 2 | Oct-2 | $2,000 | 175 | $11.43 |
|
School 1 |
Nov-20 | $1,000 | 112 | $8.93 |
| School 2 | Nov-20 | $2,000 | 175 | $11.43 |
|
School 1 |
Dec-20 | $1,000 | 112 | $8.93 |
| School 2 | Dec-20 | $2,000 |
175 |
$11.43 |
| $36,000 |
The cost per student for the organization for School 1 and School 2 from Jan 2020 through Dec 2020 is $125.44.
$36,000/(112 + 175) = $125.44
If you populate your benchmarks into the future, this method uses the most recently entered benchmark rather than the last benchmark for the selected Billing Period Range.
Reports that use custom benchmarks
Custom building benchmarks are available in Reports 2 and 22.

Dashboard content that uses custom benchmarks
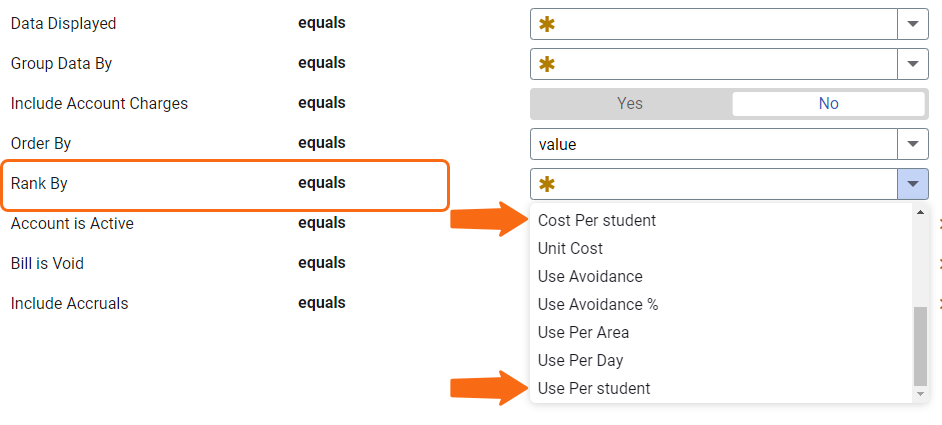
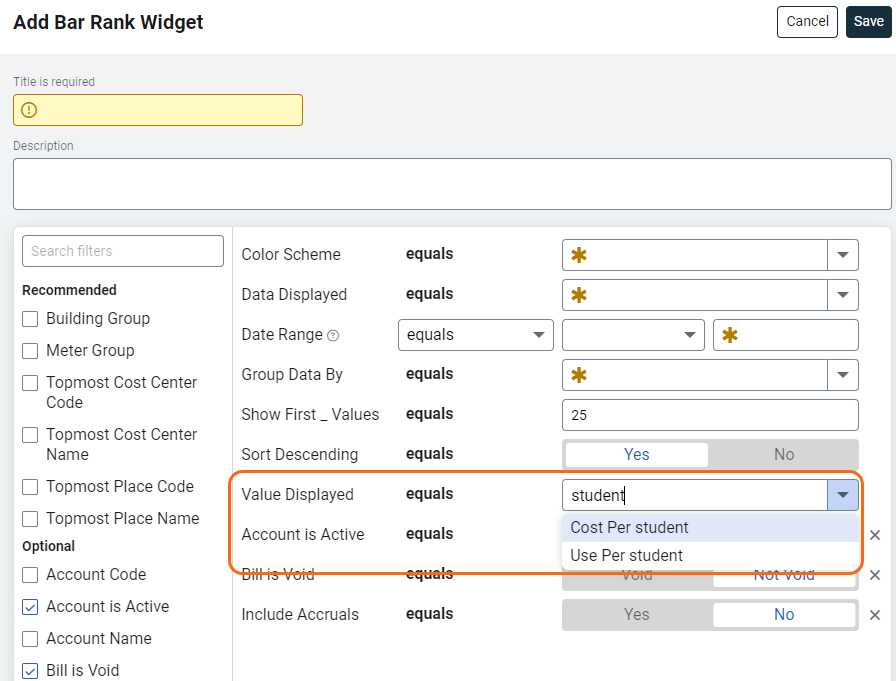
Bar Rank and Trend Chart widgets let you choose the custom benchmark.
Permissions
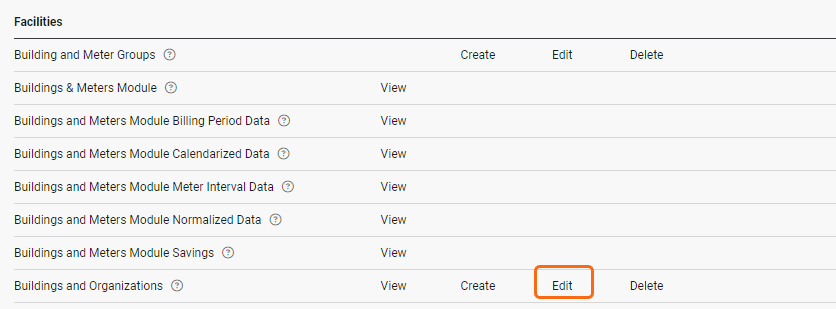
To create custom benchmarks for the entire database requires the Manage permission for Application Administration: Application Settings.

Any user with the Edit permission for Facilities: Sites and Organizations can update custom building benchmark data.
