Target comparison
Last updated May 11, 2026
Target comparison places a target line on organization, site, and meter level charts based on a selected billing year.
You can configure the target line in the Settings menu (Gear icon) or in the Sites and Meters module menu.
Set a target comparison
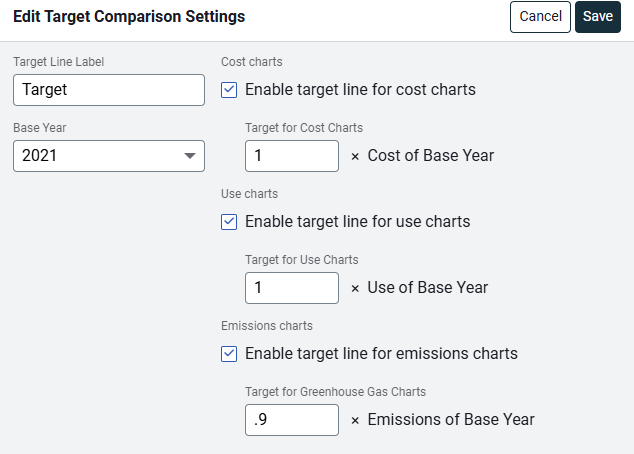
- Open the Sites and Meters module menu or the Settings menu (Gear icon).
- Click Target Comparison Settings.
- Open the Target Comparison dialog by clicking the pencil icon.
- Update your target line label.
- Set the base year.
- Check the options you want to enable.
- Add the percentage value as a decimal.
For example, 0.5 means you want to reduce by 50%.

Target lines in emissions widgets
After you enable a target comparison line you can view it on the Carbon Footprint widget by setting Show Target Line filter = Yes.

When the line is visible and you hover over individual bars (representing years), the tooltip includes goal progress. This is the progress towards your emissions goal as of that year.

Target lines in emissions reports
The Emissions Summary report (Report-44) lets you see your target comparison progress in both a chart and a table format.
If the Emissions target comparison is turned on, the report compares your base year to the five most recent years.
- The chart shows the comparison line and the table has a column with your progress towards your goal for each year. If the target comparison is turned off, these features are not on the report.