Tune your Cost Avoidance baseline
Last updated February 12, 2026
You can tune the weather model for each meter on the baseline tab.
Is the meter weather sensitive?
Before making weather adjustments, determine if the meter is weather sensitive. Does weather have a significant effect on how much energy this meter uses? For example, is the use on a natural gas meter higher in colder months?
Meters can be weather sensitive in the summer only, winter only, both, or neither. Use patterns can be very different in each season. For this reason, summer and winter graphs, weather factors, and adjustments are handled separately and independently. If a meter shows no weather sensitivity, there is no need to adjust it for weather.
How EnergyCAP adjusts the baseline weather
- Creates a mathematical model of the baseline that explains if and how the meter responds to the weather.
- Inserts the current weather into the baseline model, thereby estimating what the use in the baseline would have been if the weather had been the same as today's bill.
- Compares today's actual bill with the baseline's adjusted bill, because both values now reflect today's weather.
Save and reprocess
When you are done with your changes, save and reprocess the baseline. If you don't save before moving to another page your changes are lost.
Baseline chart explained
Each point on the chart represents a utility bill in the baseline period. Hold the pointer over a point to see the billing month represented. The bills are plotted with use on the vertical (average consumption per day in the billing period) and weather on the horizontal (average degree days per day in the billing period).
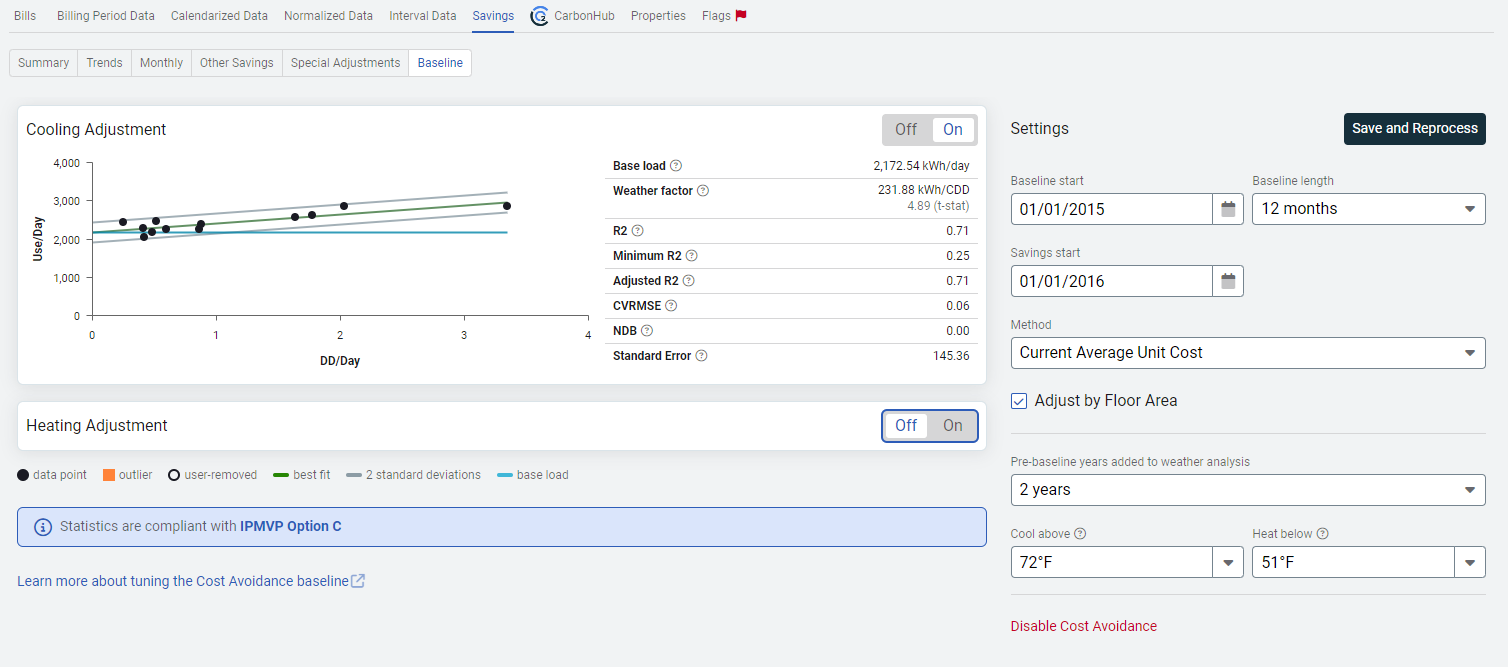
The green line is the regression line, the best fit straight line determined by single linear regression. You can run a regression analysis of these points in Excel and you will see the exact same results.
The horizontal blue line represents the y-intercept, the point of zero weather at which the regression line touches the vertical axis. This shows the use of the meter on mild non-weather days; it is the non-weather base load and represents loads such as lighting, appliances, domestic hot water, office equipment, etc.
The two parallel gray lines indicate two standard deviations from the regression line. Any point that falls outside of these lines in EITHER season is considered an outlier in BOTH seasons and is indicated by an orange dot.
An outlier is a point that doesn't fit the model and is an unpredictable month. Rather than leave it in the model and have a poor model, the outlier is excluded. This means THAT MONTH WILL NEVER BE WEATHER ADJUSTED. The CAP06 report for the meter indicates the days where weather adjustments are OFF.
Base Load
Base load is the non-weather use per day. The point at which the regression line intersects the vertical axis. In the y=mx+b equation of the line, this is b.
Weather Factor
Weather factor is the slope of the line in units of use per degree day. This indicates how weather sensitive the meter is, that is, how much use is driven by each degree day. In the y=mx+b equation of the line, this is m.
R2
R2 is the r-squared value. R-squared is set to 0 when the slope of the line is negative or when the y-intercept is negative.
Minimum R2
The minimum allowable R-squared for a statistical confidence interval of 95%. The more points on the chart, the lower the minimum R2.
Adjusted R2
Coefficient of determination divided by the degrees of freedom.
CVRMSE
Coefficient of the variation of the root mean squared error
Describes the random variability in the data normalized by the average y value (energy).
NDB
Net Determination Bias
The percentage error in the energy use predicted by the model compared to the actual energy use.
Standard error of prediction
Accuracy of estimate.
Tuning a meter
A variety of ways exist to accurately tune a meter to model the baseline.
When you are done with your changes, save and reprocess the baseline.
If Save and Reprocess is disabled you cannot make Cost Avoidance updates with your user role.
Enable Cost Avoidance
Toggle the meter on or off for cost avoidance calculations. Choose this option to include the meter in Cost Avoidance calculations. When off, no cost avoidance calculations are performed. Turn a meter off if it is irrelevant to your energy management activities.
Commodities with Cost Avoidance turned off
By default, when a new meter is created with one of these commodities, cost avoidance will not be turned on. On the Savings tab choose Baseline if you want to turn it on.
- Fire Protection
- Recycling
- Refuse
- Telecom
Cost avoidance is not enabled for these commodities because the typical cost avoidance process is to calculate cost avoidance from use avoidance, therefore a commodity that is not normally billed in units of consumption is normally not a candidate for cost avoidance reporting.
Settings
Baseline start
The first day of the baseline period.
Baseline length
Usually 12 months. Weather adjustments are disabled when the baseline exceeds 12 months because the weather in multiple baseline years cannot be averaged (we've tried, it's a lengthy explanation!).
Savings start
Savings Start is the first day cost avoidance is calculated and is referred to as the performance period. The savings start is usually the day after the baseline ends but it can be days, months, or years later.
Method
The normal default method for calculating the cost of avoided consumption is the Current Average Unit Cost.
Use the Net Cost Difference when consumption is not tracked or is irrelevant. In this case, Cost Avoidance = Baseline Cost - Current Cost.
Adjust by floor area
Normally leave this box selected, floor area differences between baseline and actual will result in a simple straight line proration.
Turn off when:
- Floor area changes are irrelevant to cost avoidance.
- Cost avoidance adjustment is more complex than a straight line proration.
- Use a special adjustment instead, using adjustment factors you have created by way of engineering calculations.
Pre-baseline years
You can add one or two years of billing data to the weather regression analysis if you have entered additional PRIOR years of bills. By adding one or two additional years, the baseline chart will include one or two years of bills preceding the baseline start date. This can be useful to obtain a better baseline regression, particularly when the 12-month baseline year is abnormally hot or cold.
Note that the baseline period is still 12 months, but the data used to create the regression model is extended to additional prior years.
Do not use this feature when the meter's weather sensitivity has changed greatly in any of these years because of HVAC equipment or building upgrades!
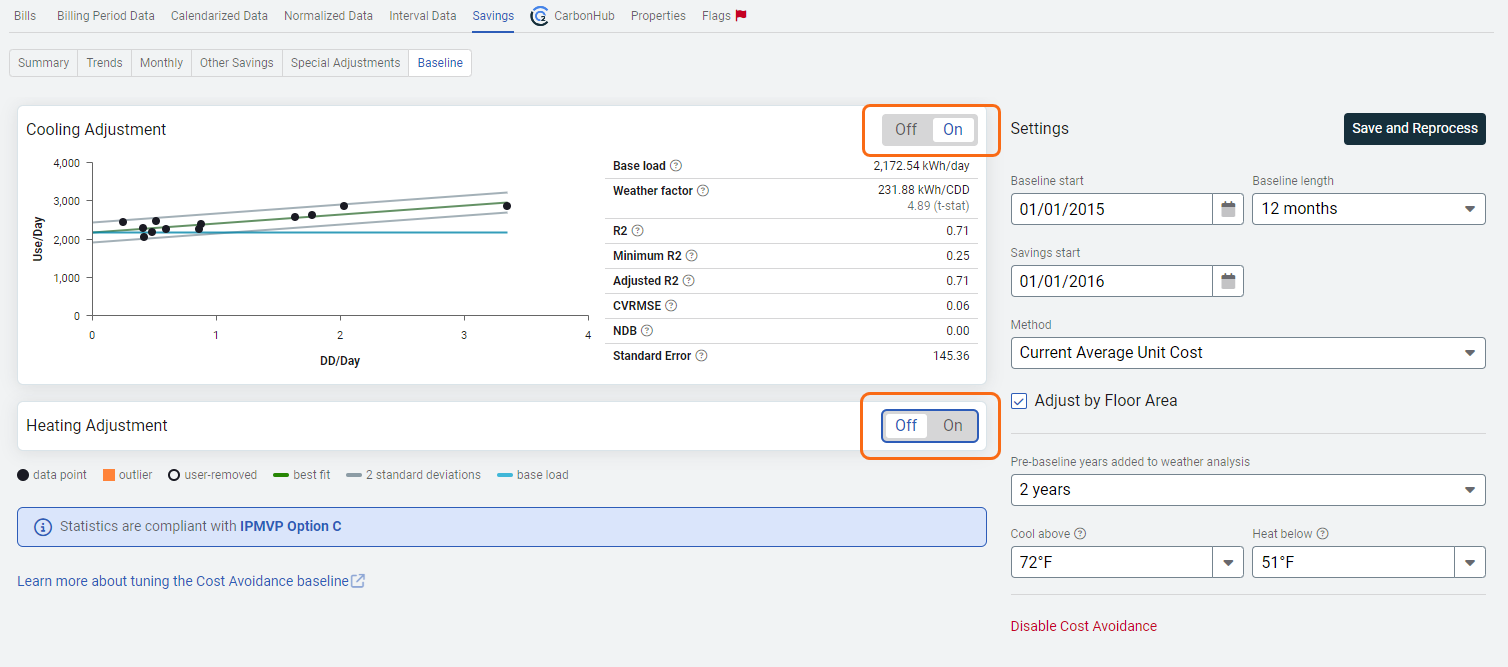
Cooling and heating adjustment
When a meter is obviously not weather sensitive in a season (a gas meter in the summer, a water meter, an electric meter in the winter in a non-electric heat building) it's best not to attempt an adjustment to save processing time and avoid potential confusion.
Cool above or heat below
This is the degree day balance point temperature for this meter, which you can adjust up or down. Meters in modern, well-insulated, highly internally loaded buildings that are not very sensitive to outside conditions will have lower balance points (average 52F-60F) while meters in older and smaller buildings that are more sensitive to the outside temperature will have higher balance points (60F-65F). Many government and industry degree day data sources use 65F as an unchangeable standard (which dates back to the 1930s) but experience has shown better correlations at lower balance points.
Delete individual months from weather chart
Deleted points are indicated by a black circle. You can click a point to manually delete it from the weather analysis. Weather adjustments will never be performed for any deleted points, in other words if you delete December because it's an abnormal point, WEATHER ADJUSTMENTS WILL NEVER BE MADE IN DECEMBER.
This makes sense when the December billing period includes a three-week holiday shutdown, so the use in December is far below what the weather model predicts. Often the manual deletion of an unusual baseline point will provide a better overall weather model, keeping in mind that the deleted month will never be weather adjusted (as shown in report CAP06 with weather indicated as OFF).