How to determine if a meter is weather sensitive
Last updated February 12, 2026
Before calculating Cost Avoidance, EnergyCAP must determine if the meter is weather sensitive. When a meter is weather sensitive, the baseline use is adjusted up or down to show what the use in the baseline would have been if the weather had been the same as the current month.
The baseline use of a weather-sensitive meter is weather adjusted for each month.
Degree days and weather-sensitive meters
- Are useful for comparing weather severity from year to year.
- Assess the weather sensitivity of meters.
- Provide more accurate calculations of Cost Avoidance.
Example
Fire Station B
|
Cooling Degree Days |
|
|
June 2017 |
140 |
|
June 2018 |
96 |
If the electric meter is weather sensitive, the fire station would have less weather-related air conditioning energy consumption (and less cost, barring any significant utility rate changes) in 2018.
What is June 2018 Cost Avoidance?
- Determine the degree of weather sensitivity for the meter
- Base load consumption (use that is not weather sensitive, such as lights, plug loads, etc.) for June 2017 is added to the weather-sensitive consumption that would have been used, if the meter had experienced June 2018 weather. The adjusted June 2017 consumption can be compared to the June 2018 consumption to determine how much more/less consumption occurred.
- Account for any variation in utility rates
- Multiply the adjusted June 2017 consumption by the Average Unit Cost of the June 2018 bill
Comparing the adjusted June 2017 cost to the June 2018 costs answers the question.
EnergyCAP uses a single linear regression analysis (see next section) based on several months or years of data to find how much meter consumption is because of weather and how much is not (the base load).
EnergyCAP's approach is to plot the baseline bills, month-by-month, on a grid with consumption on the vertical axis and weather (as expressed using the degree days concept) on the horizontal axis. EnergyCAP does this internally with statistical linear regression analysis. It is possible to obtain the same results by plotting the monthly consumption data on a graph or in a spreadsheet program.
Not weather-sensitive meter
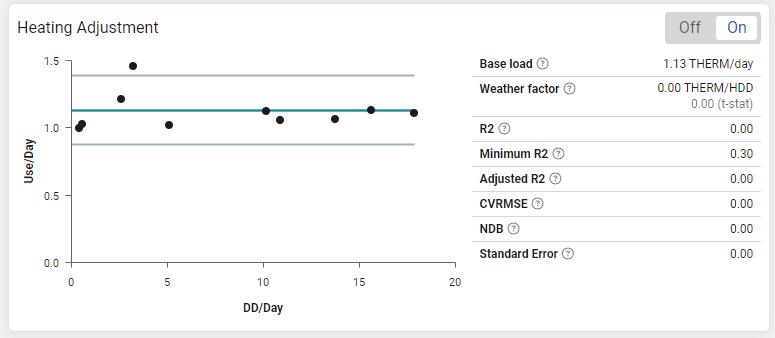
Each point represents an electric bill received in a baseline winter month. The best fit line (the green line) is found by statistical single linear regression analysis, and is called the regression line.
The regression line:
- Is nearly horizontal, meaning the meter uses about the same amount of electricity every winter month.
- R-square value (a statistical indicator of how well the dependent variable (use) correlates with the independent variable (weather) is zero).
- Slope of the line is about zero, which means the weather factor, expressed as kWh per degree day, is about zero.
Is the meter weather sensitive in winter? No, because the cold weather has no effect on use. Because the meter is not weather sensitive, there's no reason to adjust the baseline for degree days.
NOTE: A meter may be weather sensitive even though it is not statistically apparent from the baseline data. The typical case is a building so poorly controlled (for example, open windows are used to control excessive heat in the winter) no statistical correlation exists between baseline use and baseline weather.
Weather factor
The weather factor is the slope of the regression line that represents the statistical use per degree day. For example, when zero or negative, it means energy use remains unchanged or decreases when degree days increase, therefore the meter is not weather sensitive.
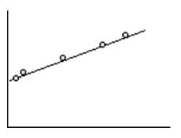
Weather-sensitive meter
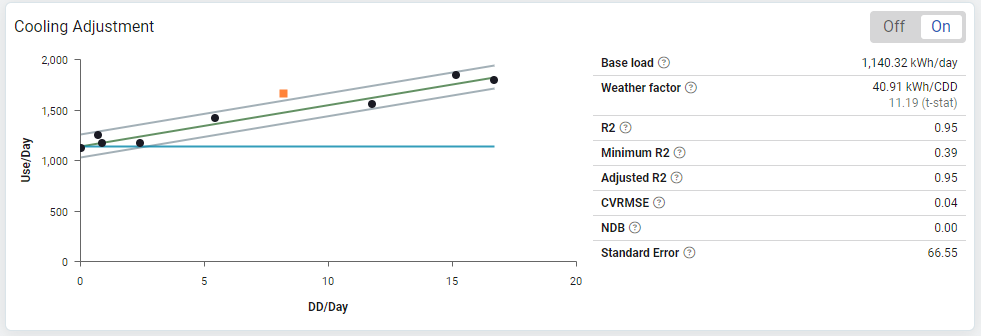
For the above regression line:
- The slope is positive (rises to the right).
- R-square value is above the minimum for determining weather sensitivity.
Is the meter weather sensitive? Yes, because warm weather has an effect on use, in a statistically validated way (R-square exceeds the minimum).
- Energy use increases as the weather gets warmer.
- Energy use approaches baseload as the weather gets cooler.
Baseline adjustments for not weather-sensitive meters
In EnergyCAP, a meter is not weather sensitive if:
- Cost Avoidance Enabled is NOT checked.
- Cooling Adjustment or Heating Adjustment is NOT checked.
- No weather analysis is attempted because it makes no sense for this meter. An example would be a water meter or a gas meter in the summer.
- The baseline length is greater than 12 months—setting the Baseline length to any value greater than 12 months disables weather analysis, even if the Cost Avoidance Enabled is selected.
- Use vs Weather analysis did not find an acceptable correlation. If a meter is not weather-sensitive, no weather adjustments are made to the baseline consumption.
Non-weather sensitive meters have their Cost Avoidance baseline bills broken into daily components without any regression applied.
The EnergyCAP processor calculates Cost Avoidance for not weather-sensitive meters with the following steps.
|
Current Billing Period |
7/15/18 to 8/14/18 (30 days) |
|
Current Use |
42,000 kWh |
|
Cost |
$3,750.00 |
- Obtain current bill data. A current bill is a bill after the start of the energy conservation measure. For example, a current bill has a billing period End Date after the Savings Start Date.
- Using the 365-day baseline period for the meter, extract the daily baseline use for the matching period of 7/15 to 8/13* and total the daily baseline use values for each day in the 7/15 to 8/13 period. This total use is called the BATCC (Baseline Adjusted to Current Conditions) because it is the raw baseline adjusted to match the billing period of the current bill, and reflects what would have been used in the absence of a Cost Avoidance/energy management program. Use the CAP06 report to see daily baseline values.
- Adjust the baseline use value for any floor area adjustments (proportional) or other special adjustments. For this example, let's assume the sum of BATCC for that billing period after all adjustments is 45,500 kWh.
- Calculate the cost of the 45,500 kWh BATCC use. Using today's average unit cost as the costing method, first calculate the unit cost of today's energy.
- Calculate Cost Avoidance. BATCC cost - Current Cost.
*The first day of the billing period is included and the last day is not.
Example
$3,750 / 42,000 kWh = $0.0843/kWh <-- apply this unit cost to the BATCC use.
45,500 kWh @ $0.0893/kWh = $4,063
The BATCC cost is $4,063. This means you would have spent $4,063 in the current period of 7/15 to 8/13 if the consumption level had stayed the same as the base year and you paid today's rates.
Cost Avoidance = BATCC Cost - Actual Current Cost
Cost Avoidance = $4,063 - 3,750 = $313
Baseline adjustments for weather-sensitive meters
The baseline creation process for a weather-sensitive meter is very different from a not weather-sensitive meter.
- Determine with the Baseline tab if the meter is weather sensitive.
- Calculate the degree of weather sensitivity using a statistical technique. A meter that consumes 1 kWh per cooling degree day is not highly weather sensitive (the weather does not cause high energy use), while a meter that consumes 100 kWh per cooling degree day is much more sensitive. The regression analysis calculates a weather factor in units of energy use per degree day. The slope of the statistical regression line is the indicator of sensitivity. A meter may be weather sensitive in one season but not in the other.
- Disaggregate each baseline bill into daily weather and non-weather components.
- Store the daily weather and non-weather components in the baseline file as shown on report CAP06. It is possible to tune the weather model by deleting any outliers in the baseline year and by adjusting the Cooling Needed Above and Heating Needed Below temperatures. An outlier is a month with an abnormal use versus weather value.
EnergyCAP may have already deleted some outliers. Any month more than two standard deviations away from the regression line are removed automatically. Any months outside the lines (which indicate one standard deviation from the regression line) are possible candidates for manual deletion, but may still be valid. Do not remove months outside of the lines unless you are confident they are abnormal and not representative. When a point is removed from the analysis, it changes to a red circle.
When outlier months are removed from the regression analysis, the entire date range of that bill is removed from weather analysis. For example, if a bill for 7/03 to 8/05 is removed, the energy use associated with that date range is never weather adjusted. This information can be reviewed in CAP06.
Adjusting the building balance point temperature
The balance point temperature
- Is the point at which a building does not require energy for heating and/or cooling.
- Used to calculate the number of heating or cooling degree days for each day in the billing period. Based on experience, a building manager may be able to assess the proper Balance Point Temperature for a specific facility.
- Is set with Cooling Needed Above and Heating Needed Below meter settings on Baseline tab.
Adjusting balance point temperature rules
- The Heating Needed Below temperature must be less than or equal to the Cooling Needed Above temperature.
- A dead band is a range of temperatures where the building requires neither heating nor cooling.
- An overlap range of temperatures where the building is being heated and cooled at the same time is not allowed for baseline modeling, although in practice this is not uncommon in a large modern building.
How to properly set heating/cooling needed temperatures
- Review R-squared values.
- Review and adjust the regression line graph (Use vs Weather).
R-Squared
- Determines the weather correlation.
- Minimum value can vary depending on the number of months plotted.
- Changes as the Balance Point Temperatures are changed (Cooling Needed Above and Heating Needed Below) to reflect changes in the statistical correlation of the points.
- The minimum R-squared value changes when outliers are removed because the minimum is based on the number of points.
- Fewer points require a higher R-squared value for the same 95% confidence level.
- Many temperature settings have R-squared values over the minimum required for a weather correlation.
- The very highest R-squared value is not always the correct option.
- For example, the highest R-squared for an elementary school's balance point temperature may be at 37 degrees, but the building manager knows the boiler controls turn on the heat at 55 degrees outside temperature. Use 55 instead of 37.
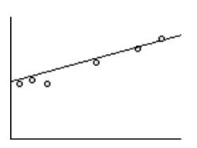
Regression line
Review the months plotted on the graph. Because the regression line must be a single straight line, EnergyCAP plots the line as shown below.
The screenshot below shows a more appropriate plot for these points, the combination of a flat and sloped line. This reveals the balance point temperature is probably set too high (if heating) and too low (if cooling). The leftmost months are all the same use, showing no effect from the weather.
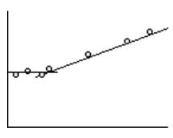
Experiment with editing the temperature setting so less sensitive weather months fall off the graph to the left, providing a better estimation of Heating Needed Below temperature.
Knowledge of a building can be used to make better assumptions. Is September a heating month? If so, it should be listed on the heating graph. If not, lower the heating temperature so September falls off the graph. Use the same approach for cooling months.
If you don't use the Baseline tab to tune the weather model, the processor automatically creates one for you using the global default temperature, automatically deleting any outlier bills more than two standard deviations outside the regression line.