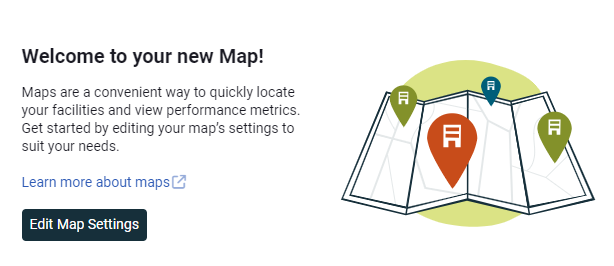
Add a map with Create (plus sign)
Last updated April 30, 2026
The Create dialog provides quick access to manual bill entry, importing files, and creating common objects.
Click the plus sign and then Add Map.

Fill out the Map Settings form
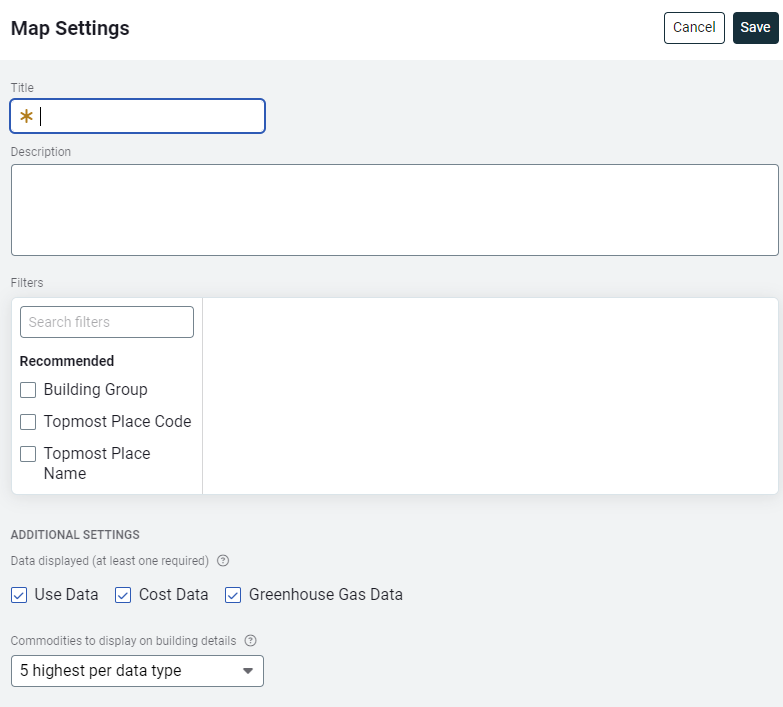
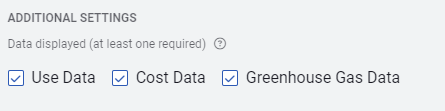
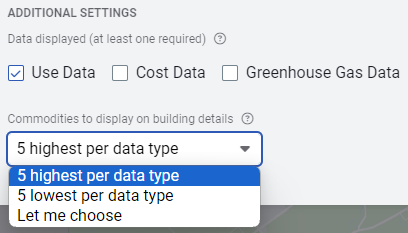
Map Form - Additional Settings
Choose what information you want to be available for viewers.
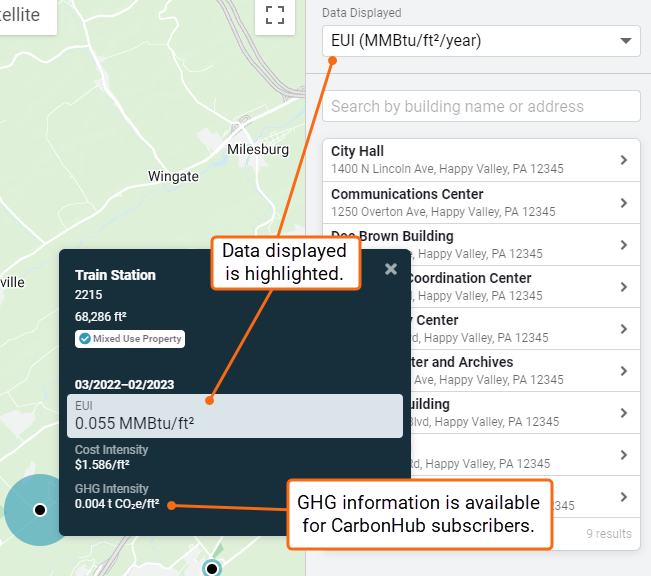
How to view commodity information on a map
You can choose how to display commodity metrics—highest to lowest or lowest to highest—or you can select the specific commodities you prefer to see. *This selection does not impact the site totals.
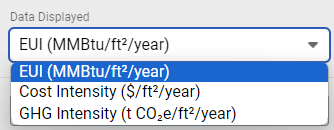
Visual indicator on map
You can benchmark your sites from the map. A visual indicator shows the relative Energy Use Intensity (EUI, MMBtu/floor area/year) or Cost Intensity (cost/floor area/year) based on your display settings.
The map circles are relative in size to each other. If your map circles look incorrect, check to make sure the site area is correct.
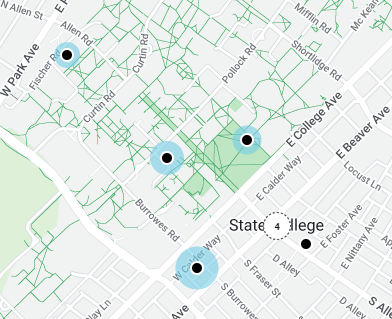
When you hover over the black dot representing a site, the tooltip displays more data.