Normalization overview
Last updated January 23, 2026
Normalization adjusts your energy use data by applying the weather conditions from a selected comparison year to all bills. This removes weather as a variable, making it easier to compare energy use across years.
Why normalize data?
- Make accurate year-over-year comparisons of energy use.
- Measure energy savings from operational improvements—not weather changes.
- Improve long-term energy analysis, especially in Energy Use Intensity (EUI) charts.
Limitations of normalization
- You cannot tune weather regressions by meter (like in Cost Avoidance) so you cannot adjust balance point temperature by meter or delete outliers.
- No adjustments are made, or can be made, for any other significant variables over time (occupancy, new loads, etc., although EUI charts do account for floor area).
- Non-weather sensitive meters return normalized data that matches calendarized data.
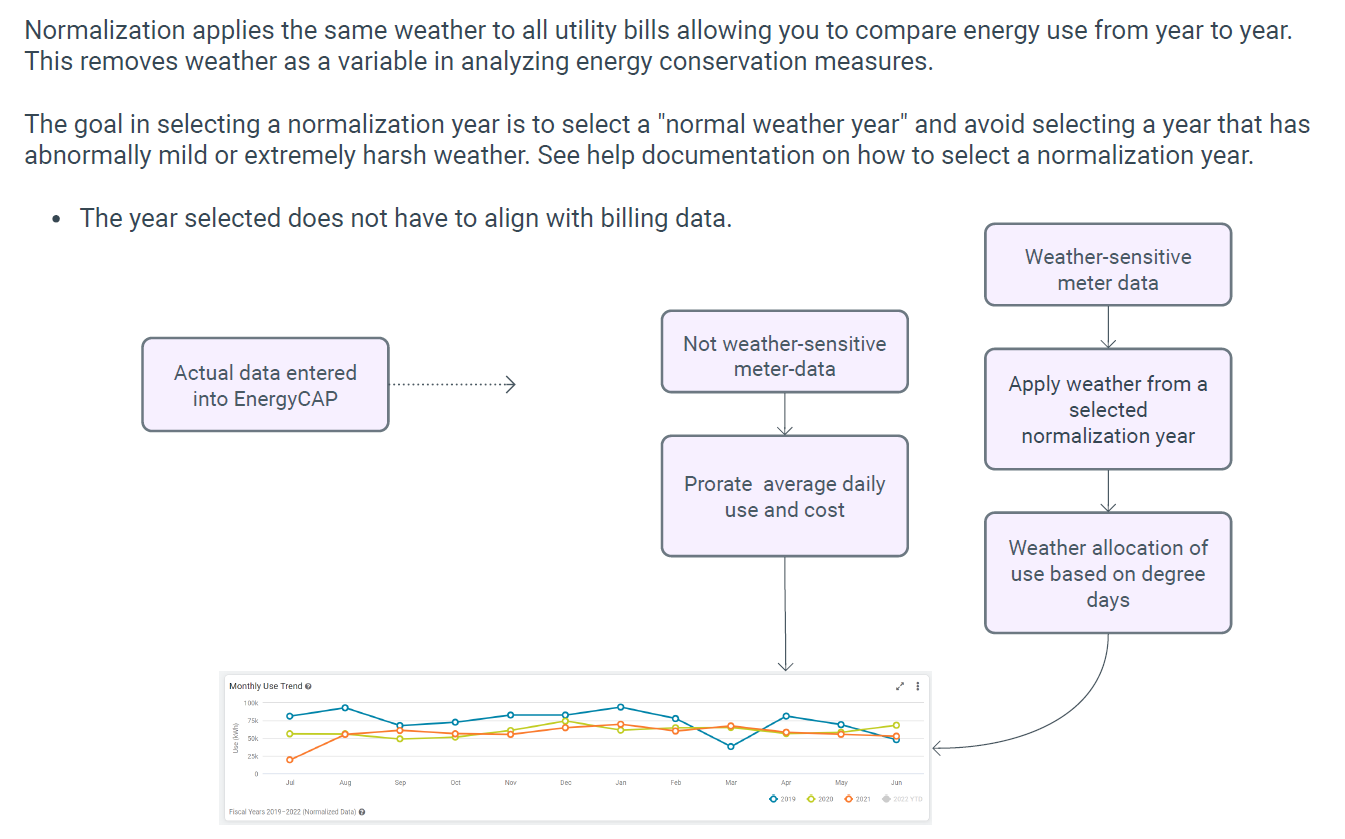
Weather-sensitive meters use the degree days from the user-defined normalization comparison year. Use Weather Data Depot to determine a typical degree day year as the comparison year. Avoid using an extreme weather year.
Normalization shows estimated (hypothetical) data. "How much would I have used if the weather for all years were equal to 2017?"
Normalization diagram