EnergyCAP 8.0.0 release notes
GHG Updates
We’ve updated our Greenhouse Gas reporting options to give you more visibility into your emissions data.
- GHG data is now on the calendarized tab. Calendarized data gives you a more accurate view of your use and cost because most utility bills don’t correspond to the calendar month.
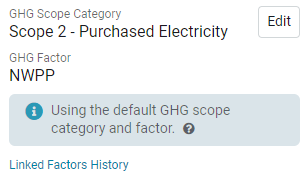
- It’s easy to view your default categories and factors.
- View category and factor information for each meter on the Properties tab.
- GHG emissions are no longer calculated from channels, Emissions are only calculated from bills.
Carbon Hub
EnergyCAP’s newest solution, Carbon Hub, serves as the central repository of all carbon emissions related data. Learn more about upgrading to this advanced feature.
GHG accounting made easy
- You can track and report on scopes 1, 2, and 3 at the meter, building, and portfolio level.
- It’s easy to change the scope category and factor assigned to each meter.
- For easy setup, set default scope categories and factors for each commodity.
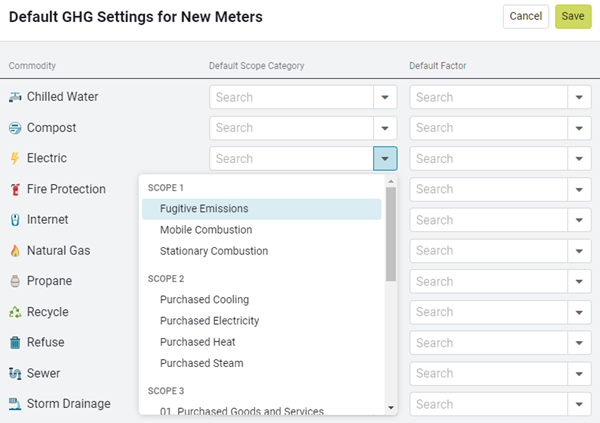
- Automatically calculate emissions with default GHG factors from the EPA and IEA.
- Create your own custom, date effective GHG factors for advanced scenarios.
Track progress towards targets
- Set GHG emissions targets and track progress towards the goals at different levels.
- You can visualize emissions data by resource, location, gas type, floor area, and primary use.
- Track year-over-year emissions data and progress towards goals.
- Create and share dashboards that display up-to-date emissions data.
Powerviews and reports
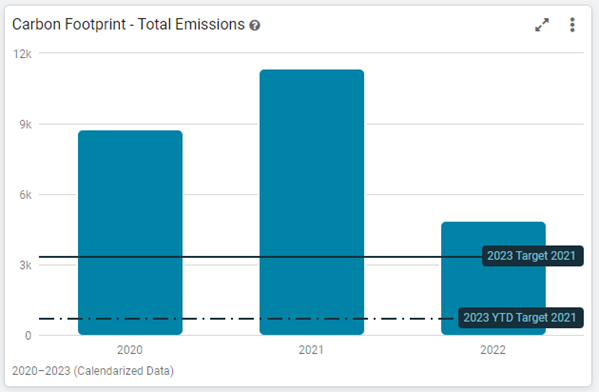
- We’ve added new GHG charts for organizations, buildings, and meters to show total emissions, scope 1, 2, and 3, and your carbon footprint for the last 4 years.
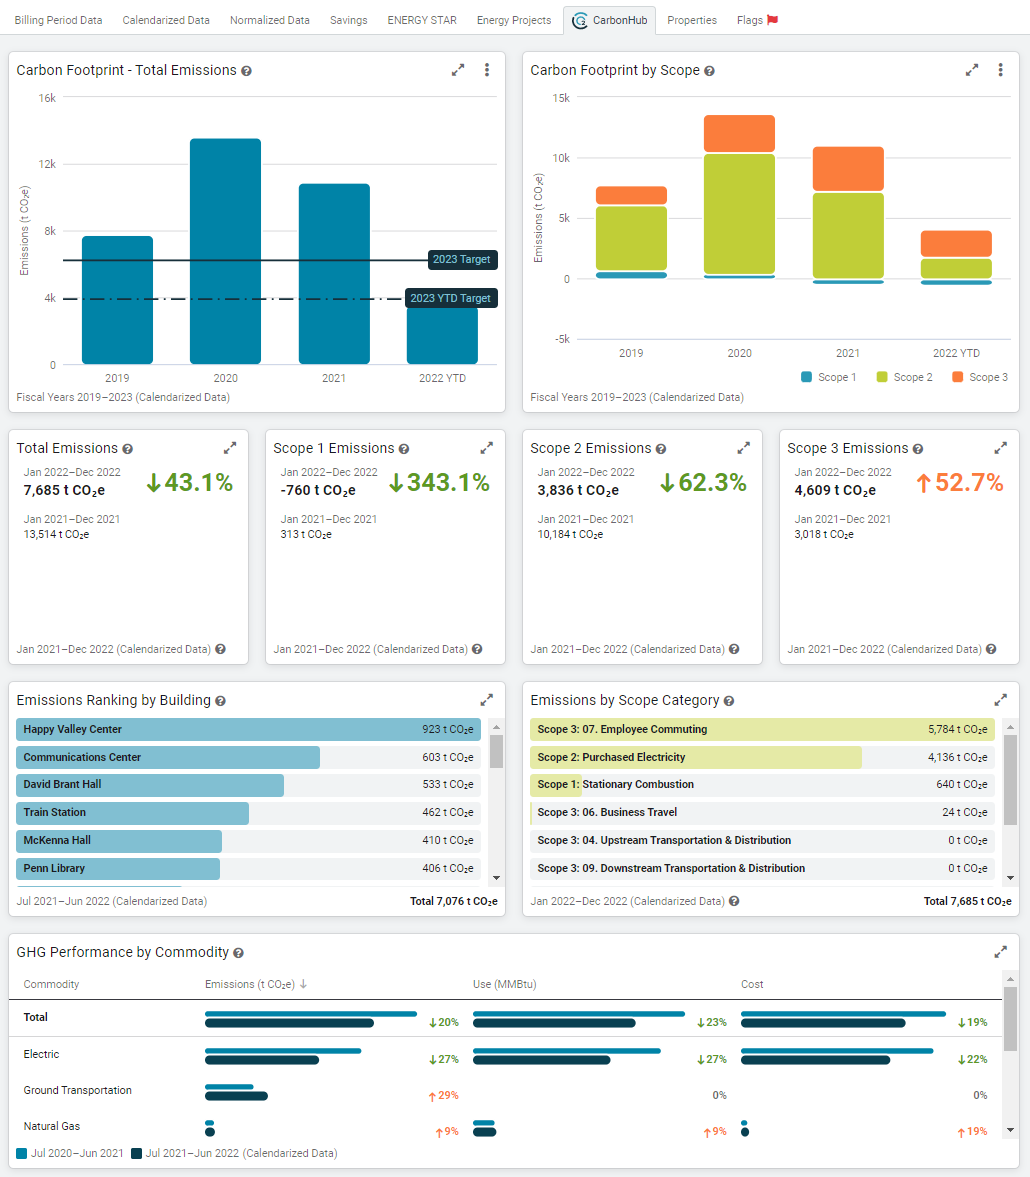
- As you build your Carbon Footprint dashboard, you’ll see new widgets for GHG reporting and we’ve added the Total Emissions filter to several existing widgets and reports.
Assessment Report
- You can easily see the Assessment Report version that is being used to calculate your GHG emissions.
- The AR version is listed in the details of GHG widgets and report footers.
- Contact our support team if you want to change the version.
Widget filters
- Total Emissions is available as a filter option in more dashboard widgets including Bar Rank and Trend Chart.

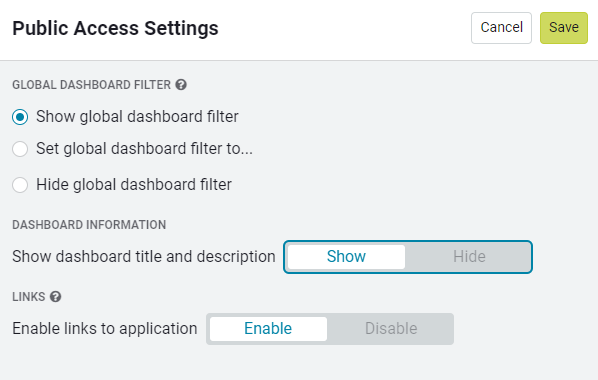
New settings for public dashboards and maps
We’ve made several improvements to dashboards to give you more control on how you share public dashboards and maps. These improvements require you to reshare your public dashboards because the existing links and embed codes will no longer work.
These changes are effective February 12, 2023. On this date all existing public dashboards and maps will redirect to a blank page with the message “This dashboard is no longer available.”
What do you need to do?
Update the settings for any public dashboard or map that you want to keep, copy the new link, and send it to recipients or update websites with the new embed code. If you don’t update your code anyone that views your public dashboard or map will see a blank page with the message, “This dashboard is no longer available.”
Dashboard Updates
We’ve listened to your feedback and made it easier for you to create and manage your dashboards.
- Added a description field to dashboards and widgets so you can provide more information to your viewers.
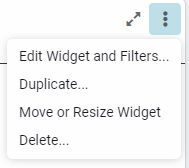
- No need to unlock your dashboard before you can edit the layout or add widgets.
- We’ve added an expanded view button to access the details of the widgets. From here you can copy the data used in the chart.
Duplicate widgets
Want to copy and change a few details on one of your favorite widget? Now you can!
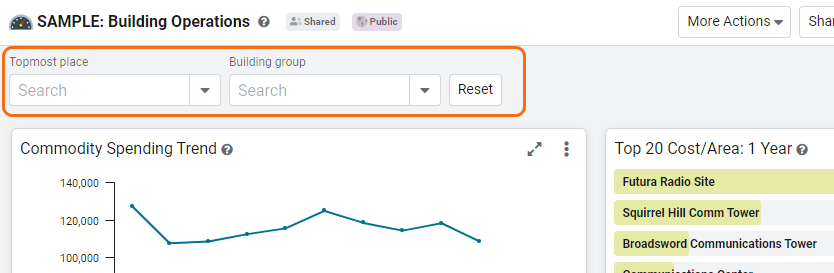
Global dashboard filter
We’ve moved the dashboard filter to make it easier to use. This global filter helps you quickly see a subset of your dashboard data.
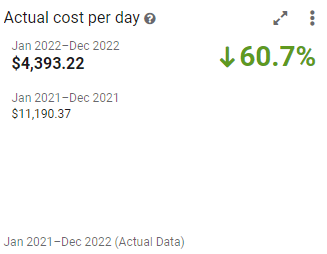
New KPI widget
A new KPI widget that lets you compare year-to-year performance, it includes a color coded up or down arrow to let viewers quickly see the status.
Other Updates
- We updated labels in the application to better reflect the type of data they represent. We replaced the label Actual Data with Billing Period Data because we feel this label better represents the type of data you are viewing.
- With this change we are also updating the label for the Billing Period filter on most reports and widgets. The label for this filter is now Date Range.
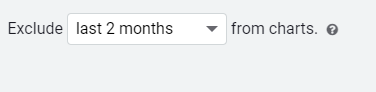
- A new setting is available for you to set that will exclude the specified number of months from all charts in the application.
- Any dashboard charts where date range is set to prior 12 months (offset by excluded months) or uses the Number of Years filter.
*Not all charts in dashboards and powerviews have been upgraded to use the new setting but will be over the next couple months. -
For example, if the current month is September and last 2 months is selected, September, August, and July would be excluded from charts.
- Any dashboard charts where date range is set to prior 12 months (offset by excluded months) or uses the Number of Years filter.
-
Legacy GHG reports have been removed from the application as they are no longer compatible with calendarized GHG data (GHG01, GHG02PT, GHG03, GHG04, GHG05).
- The filter Total Emissions is available on:
- Report-01
- Report-08
- Report-10
- Report-23
- The filter Total Emissions is available on: