EnergyCAP 8.1 release notes
Map Improvements
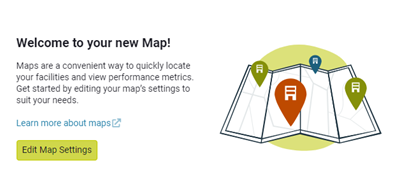
We've made creating a map easier and added new options to view building information and give you more control with how to display your data. As soon as you create your new map, you'll add the name and configure your settings.
Enter the map details and set your filters.
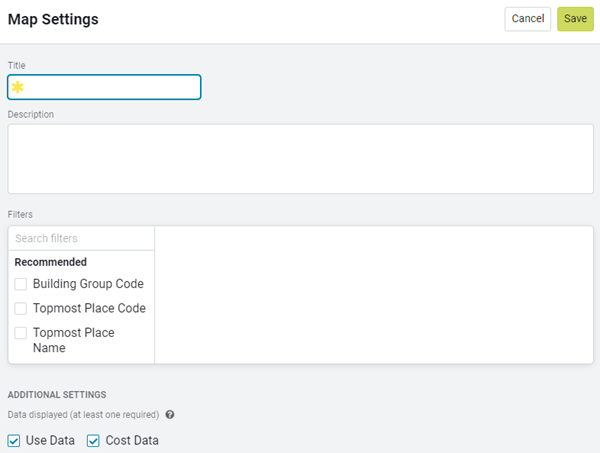
Additional Information
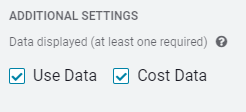
Choose what information you want to be available for viewers.
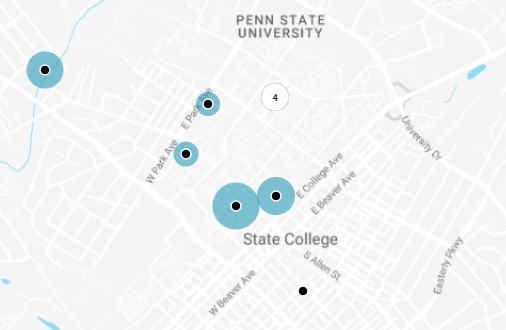
Benchmark
Now you can benchmark your buildings from a map. A visual indicator shows the relative Energy Use Intensity (EUI, MMBtu/floor area/year) or Energy Cost Intensity (ECI, cost/floor area/year) based on your display settings.
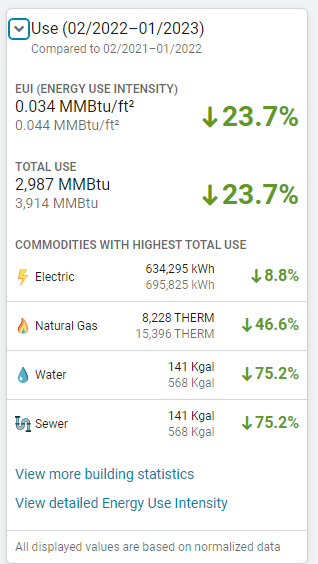
Cost and Use Details
Quickly see important building statistics at a glance and use hyperlinks to view more building details.
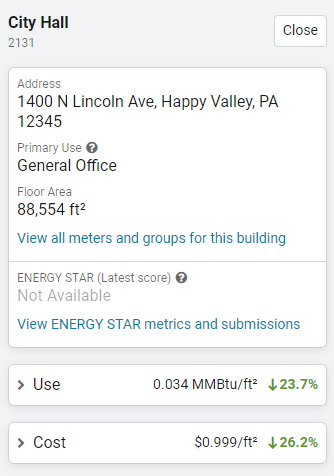
Expand Use or Cost sections to see more information. Building use charts are based on normalized data and building cost is based on calendarized data.
Look for additional map updates coming in the next few months.
Feature Requests
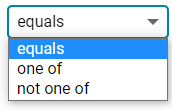
You asked for it and we delivered! We've updated several dashboard widget filters to be more flexible and provide you with the data you need.
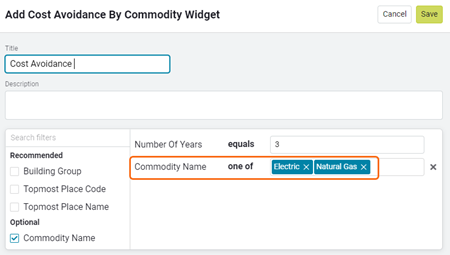
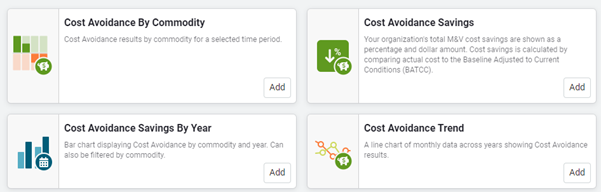
Cost Avoidance by Commodity
You can now select one or more commodities to be included in your Cost Avoidance widget chart.
Missing Bills
You can narrow your search for missing bills by specifying the exact vendors you want to include or exclude in your widget data.
- Specify one vendor
- Choose one or more vendors
- Exclude one or more vendors