Report-06
Last updated May 13, 2026
Year-over-Year Comparison
Report-06 displays a data table that compares key metrics—such as use and cost—across meters, sites, and other objects for two to five consecutive time periods. For example, you can compare December 2024 to December 2025 or the full year of 2024 to 2025.
Time frame
The report can include up to five years of data.
What the report shows
- Use
- Demand
- Cost
- Unit cost
- Other key values
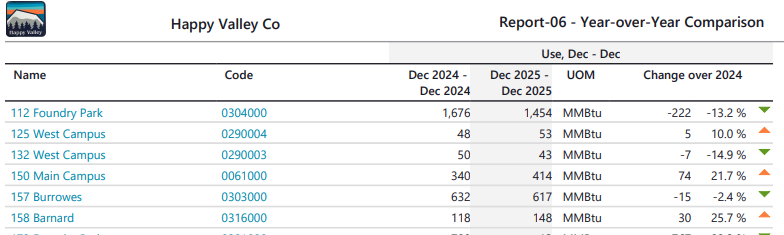
The report also displays the percentage change between the two most recent years.
Red and green arrows help you quickly identify increases and decreases.
Results are sorted alphabetically for easy review.
Example uses
- Compare energy costs by commodity for two years.
- Compare electric meter use for December 2024 and December 2025.
- Compare energy use or cost by site across two years.
Use case
This report helps identify trends, growth, or reductions in utility use and spending across facilities over time.
Report-06 is available as: PDF, Excel, Excel data only, Word

Report-06 recommendations
- When you are reporting on Cost Avoidance, remember to run Cost Avoidance -> Calculate Savings first.

Report-06 tip
When comparing USE year-to-year you may want to use normalized for Data type because it removes weather as a variable.
When comparing COST it is recommended to use calendarized data for Data type because it gives a more accurate representation of cost by prorating it per day.
Set your filters for Report-06
- Choose the type of data you want in your report with the filter Data type.
Data set When to use it Why it helps Billing Period Accounting, chargebacks, or any task that needs the exact bill dates Uses the raw start and end dates from the utility bill Calendarized Month-to-month or year-over-year analysis of cost and usage Spreads each bill across true calendar months so totals line up with financial periods. Displays both use and cost. Normalized Year-over-year usage analysis Adjusts energy use for weather, removing temperature as a variable - End period
Sets the end month for the report. - Group by
Determines what is on each row. TIP: A common selection is Sites; this creates a report with the sites in alphabetical order. - Decide if you want to Include account charges. Account line item charges are one-time or periodic charges. A charge is typically assigned at the account level when it does not have a link or relation to the use or demand on the bill.
- Number of months set the months you want to report on. The months returned are based on the End Period filter.
- Set the Number of years you want in the report.
- Value is what is listed in each column.
Other filters to consider for Report-06
- Commodity category
Groups commodities into broader categories such as Electric or Gas. Use this filter when you want to roll up all commodities within a category rather than selecting individual ones. Not compatible with the Commodity filter. - Active accounts only
Decide whether to include only active accounts.
If this filter is not applied, your report includes both active and inactive accounts. - Void bills
Include if you want a full audit history.
Exclude to focus only on valid financial activity. - Topmost place
When set to a specific organization, and paired with Group by site, the report shows one chart or table per site under that organization.
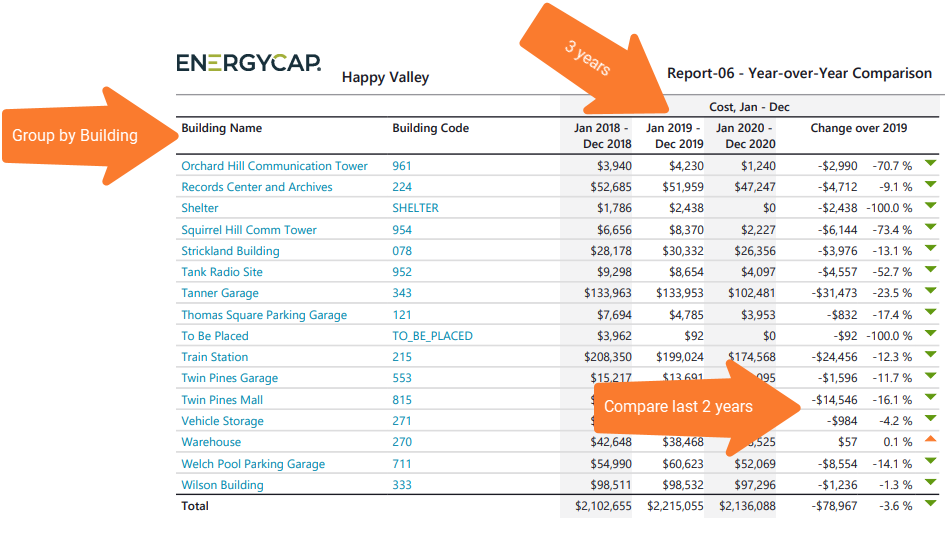
Example Report-06
The example filters shown here show how to compare the cost of all commodities for a three year time period for all sites in the organization.

Available filters for Report-06
Required filters for Report-06
- Data type - Can be calendarized, billing period, or normalized.
- End month - For Report-06 three filters work together - End month, Number of months, and Number of years. These filters determine what data is in your report. Set the end month and year for the report.
- Group by - For Report-06 this determines what is on each row in your report (commodity, buildings, meter). TIP: A common selection is Sites; this creates a report with the sites in alphabetical order.
- Include account charges - Account charges are separate from meter charges and not used in calculating unit cost. (For example, late fees, connection charges, or deposits)
- Number of months (1-12) - For Report-06 this filter sets the number of months you want to report on. The actual months returned are based on the End month filter. For example, if you want to report on the last 6 months of the 2020 calendar year, set the End month to December 2020 and Number of months equal to 6.
- Number of years (2-5) - For Report-06 this filter sets the number of years you want (2, 3, 4 or 5) included in the report. The percentage change is only provided for the two most recent years.
- Value - For report-06 you can select: cost, Cost Avoidance, cost per area, demand, unit cost, use, use per area.
Recommended filters for Report-06
- Meter group - Filter for specific groups. To include all group members, do not set a topmost filter. You can combine with other filters if you want to refine your results.
- Site group - Filter for specific groups. To include all group members, do not set a topmost filter. You can combine with other filters if you want to refine your results.
- Topmost cost center code - topmost cost center you want to be included. When you set a topmost cost center it is the highest level of the accounting tree used, this lets you select a subset of data for reporting.
- Topmost cost center name - Select the topmost cost center you want to be included. When you set a topmost cost center it is the highest level of the accounting tree used, this lets you select a subset of data from your tree for reporting.
- Topmost place code - Select the topmost organization or site you want to be included. When you set a topmost organization or site it is the highest level of the facilities tree used, this lets you select a subset of data from your tree for reporting.
- Topmost place name - Select the topmost organization or site you want to be included. When you set a topmost organization or site it is the highest level of the facilities tree used, this lets you select a subset of data from your tree for reporting.
Optional filters for Report-06
- Account is active - If this filter is not included, both active and inactive accounts are included in the report.
- Account name - Filter for one or more accounts. This filter is not compatible with topmost or group filters.
- Account number Filter for one or more accounts. This filter is not compatible with topmost or group filters.
- Accounts in cost center code - Filter to include accounts directly under one or more cost centers. To see all the accounts at a certain level in your hierarchy use the Topmost cost center filter. This filter is not compatible with other topmost or group filters.
- Accounts in cost center name - Filter to include accounts directly under one or more cost centers. To see all the accounts at a certain level in your hierarchy use the Topmost cost center filter. This filter is not compatible with other topmost or group filters.
- Bill is from external vendor - When this filter is not selected, the report includes data from both vendor (external) and chargeback (internal) bills.
- Bill is void - If this filter is not included, both void and not void are included.
- Commodity - Select one or more specific commodities such as Electricity, Natural Gas, or Water. Use this filter when you need individual commodities broken out separately. Not compatible with the Commodity category filter.
- Commodity category - Groups commodities into broader categories such as Electric or Gas. Use when you want to roll up all commodities within a category rather than selecting individual ones. Not compatible with the Commodity filter.
- Include accrual bills - If this filter is not included, the report includes accrual bills.
- Meter code - Filter to include one or more meters. This filter is not compatible with topmost or group filters.
- Meter name - Filter to include one or more meters. This filter is not compatible with topmost or group filters.
- Meters in site code - Filter to include meters directly under one or more sites. To see all the meters at a certain level in your hierarchy use the topmost place filter. This filter is not compatible with other topmost or group filters.
- Meters in site name - Filter to include meters directly under one or more sites. To see all the meters at a certain level in your hierarchy use the topmost place filter. This filter is not compatible with other topmost or group filters.
- Vendor code - Filter by one or more vendors, to see all vendors do not include a topmost or group filter. You can combine with other filters if you want to refine your results.
- Vendor name - Filter by one or more vendors, to see all vendors do not include a topmost or group filter. You can combine with other filters if you want to refine your results.