Report-10
Last updated May 11, 2026
Two-Year Comparison
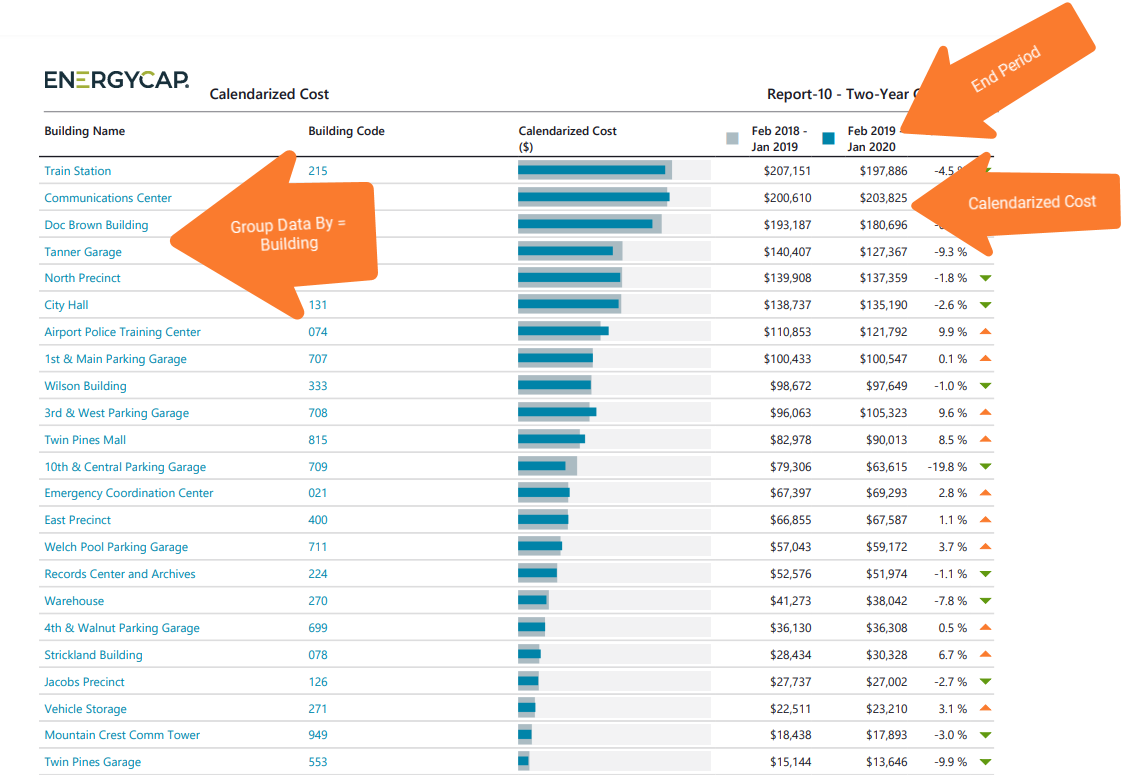
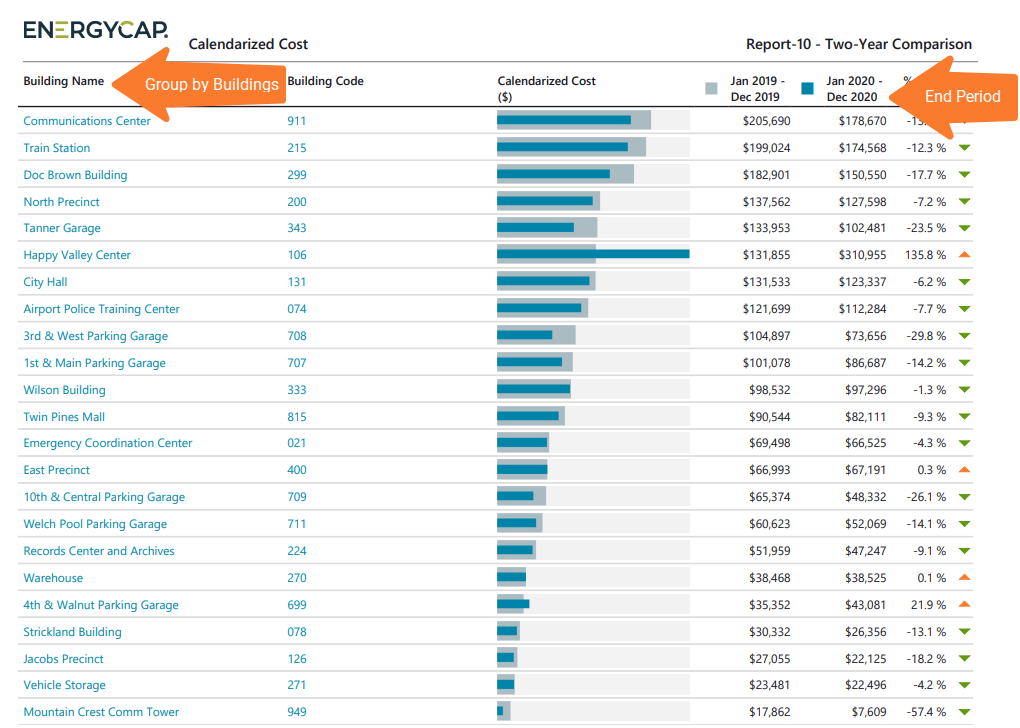
Report-10 displays a data table and bar chart that rank objects and compare data across two years. Use the End Period filter to define the two-year reporting period.
What the report shows
- Percent difference between the two years.
- Red and green arrows help you quickly identify increases and decreases.
- Yearly cost for each year.
- A bar chart that compares actual cost for both years:
- Previous year shown in gray.
- Current year shown in blue.
Why it’s useful
Use this report to compare performance across two years and quickly identify changes in cost between objects.
Example uses
- Compare the costs for 2024 and 2025 for the sites in a selected topmost.
- Compare the use of all electric meters for 2024 and 2025.
Report-10 is available as: PDF, Excel, Word
Report-10 recommendations
- The filter Group by determines the objects on each row, a common option is sites.
- If you use chargebacks, remember to use the appropriate Topmost place or Topmost cost center to avoid double counting use or cost.
Report-10 tip
When comparing USE year-to-year you may want to use normalized for Data type because it removes weather as a variable.
When comparing COST it is recommended to use calendarized for Data type because it gives a more accurate representation of cost by prorating it per day.
Set your filters for Report-10
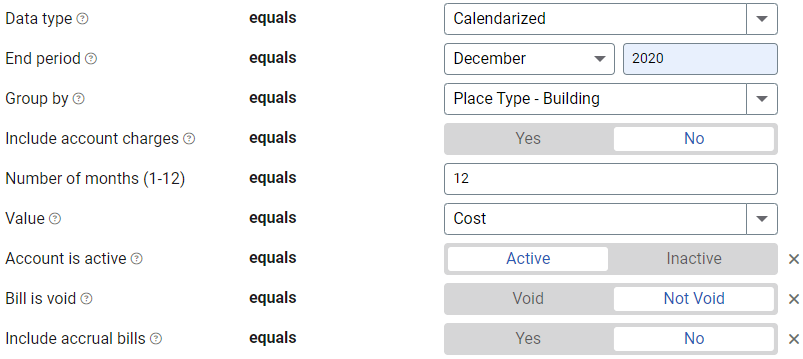
- In the Data type field, choose the data set you want to use for the report.
Data set When to use it Why it helps Billing Period Accounting, chargebacks, or any task that needs the exact bill dates Uses the raw start and end dates from the utility bill Calendarized Month-to-month or year-over-year analysis of cost and usage Spreads each bill across true calendar months so totals line up with financial periods. Displays both use and cost. Normalized Year-over-year usage analysis Adjusts energy use for weather, removing temperature as a variable - End period.
This sets the end of the two year period. - Group by
Decide the objects on each row with the filter. - Include account charges.
Decide whether to include one-time or periodic charges.
These are not linked to use or demand on the bill. - Number of months
Sets the number of months for each column. Enter 3 for a quarterly report or 12 for a full year report. - Value
Select what you want to report on. Values include: Cost, Cost per area, Cost per day, Total emissions, Unit cost, Use, Use per area, Use per day.
Other filters to consider for Report-10
- Active accounts only
Decide whether to include only active accounts.
If this filter is not applied, your report includes both active and inactive accounts. - Void bills
Include if you want a full audit history.
Exclude to focus only on valid financial activity.
Example filters for Report-10
This set of filters creates a 2 year cost comparison report of sites for the years 2019 and 2020 using calendarized data.
Available filters for Report-10
Required filters for Report-10
- Data type - Can be calendarized, billing period, or normalized.
- End period - This sets the end period for the report.
- Group by - This determines what is on each row in your report (commodity, sites, meter).
- Include account charges - Account charges are separate from meter charges and not used in calculating unit cost. (For example, late fees, connection charges, or deposits)
- Number of months (1-12) - Select the number of months for the report.
- Value - Select the value to report on. Values include: Cost, Cost per area, Cost per day, Total emissions, Unit cost, Use, Use per area, Use per day.
Recommended filters for Report-10
- Meter group - Lets you filter the report to a specific group of meters.
- Site group - Lets you filter the report to a specific group of sites.
- Topmost cost center code - When you use this filter you are selecting the topmost cost center you want to be included. When you set a topmost cost center it is the highest level of the accounting tree used, this lets you select a subset of data for reporting.
- Topmost cost center name - When you use this filter you are selecting the topmost cost center you want to be included. When you set a topmost cost center it is the highest level of the accounting tree used, this lets you select a subset of data for reporting.
- Topmost place code - Select the topmost organization or site you want to be included. When you set a topmost organization or site it is the highest level of the facilities tree used, this lets you select a subset of data from your tree for reporting.
- Topmost place name - Select the topmost organization or site you want to be included. When you set a topmost organization or site it is the highest level of the facilities tree used, this lets you select a subset of data from your tree for reporting.
Optional filters for Report-10
- Account code - Filter for one or more accounts. This filter is not compatible with topmost or group filters.
- Account is active - If this filter is not included, both active and inactive accounts are included in the report.
- Account name - Filter for one or more accounts. This filter is not compatible with topmost or group filters.
- Bill is from external vendor - When this filter is not selected, the report includes data from both vendor (external) and chargeback (internal) bills.
- Bill is void - If this filter is not included both void and not void are included.
- Commodity - Select one or more commodities to report on. This filter is not compatible with the Commodity category filter.
- Commodity category - This filter is not compatible with the Commodity filter.
- Cost center code - Filter to one or more cost centers to include.TIP: To see all the cost centers at a certain level in your hierarchy use the Topmost cost center filter. This filter is not compatible with other topmost or group filters.
- Cost center name - Filter to one or more cost centers to include.TIP: To see all the cost centers at a certain level in your hierarchy use the Topmost cost center filter. This filter is not compatible with other topmost or group filters.
- Include accrual bills - If this filter is not included, the report includes accrual bills.
- Meter code - Filter to one or more meters. This filter is not compatible with topmost filters.
- Meter name - Filter to include one or more meters. This filter is not compatible with topmost or group filters.
- Site code - Filter to one or more sites to include in the report. Not compatible with topmost or group filters.
- Site name - Filter to one or more sites to include in the report. Not compatible with topmost or group filters.
- Vendor code - Filter by one or more vendors, to see all vendors do not include a topmost or group filter. You can combine with other filters if you want to refine your results.
- Vendor name - Filter by one or more vendors, to see all vendors do not include a topmost or group filter. You can combine with other filters if you want to refine your results.