Report-12
Last updated May 13, 2026
Visual Bill Audit
Report-12 helps you spot unusual trends in your utility data—whether it's abnormal usage, cost, demand, or unit cost.
Report-12 includes:
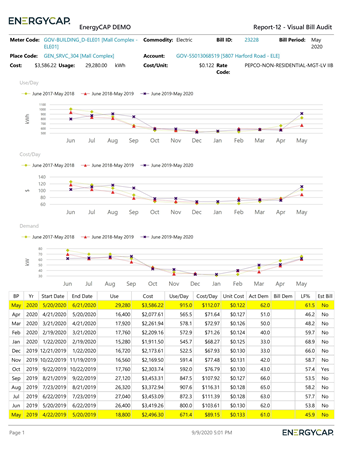
- Trend line charts
These charts display patterns over time, making it easier to see if something looks off—like a sudden spike or drop in usage or cost. - Bill history
For each account or meter, the report can pull up to 59 months of historical bill data, giving you a long-term view for comparison. - Detailed data table
A table below the chart lists the most recent 13 months of bills. These are the bills used to generate the trend lines.
Why use this report?
- Spot billing errors quickly.
- Investigate sudden changes in utility performance.
- Compare recent bills against long-term history for each meter or account.
Report-12 is available as: PDF, Excel
Report-12 tip
This report is designed to visually audit current bills. You should either set the Billing period to a recent month, choose a recent Batch, or set the Bill entry date to see bills recently entered.
Set your filters for Report-12
- Active accounts only
Decide whether to include only active accounts.
If this filter is not applied, your report includes both active and inactive accounts. - Void bills
Include if you want a full audit history.
Exclude to focus only on valid financial activity. - Number of comparison years
This sets the number of historical years to use for comparison to the current bill. - Billing period
Select the billing period you want to review. - Limit the report to a subset of data
Set a filter such as Topmost place, Site group, or Commodity.
Other filters to consider for Report-12
- Cost
Reduce the size of the report by filtering out low-cost bills that may not need review.
Available filters for Report-12
Required filters
- Account is active - If this filter is not included, both active and inactive accounts are included in the report.
- Bill is void - If this filter is not included both void and not void are included.
- Number of comparison years - Number of historical years to use for comparison to the current bill.
Recommended filters
- Account number - Filter for one or more accounts. This filter is not compatible with topmost or group filters.
- Batch - For Report-12 it’s recommended to select a recent month, batch, or set the bill entry date to bills that were recently entered.
- Billing period - For Report-12 it’s recommended to select a recent month, batch, or set the bill entry date to bills that were recently entered.
- Commodity - Select one or more commodities. This filter is not compatible with Commodity category.
- Commodity category - Groups commodities into broader categories such as Electric or Gas. Use when you want to roll up all commodities within a category rather than selecting individual ones. Not compatible with the Commodity filter.
- Cost - Filter to one or more bills based on cost. To see all the bills, do not set a topmost, date range, or other specific filters.
- Cost recovery - Filter to bills with the cost recovery amount within the specified range. TIP: You track savings for each bill with the cost recovery option of a bill flag.
- Flag assigned to me - Select yes or no.
- Flag assignee - Filter for bills with specific flag assignees. To include all the matching bills do not set filters such as Billing period, Accounting period, or topmost filters. TIP: You can combine with other filters if you want to refine your results.
- Flag issue - Filter for bills with one or more flag issues. To include all the matching bills do not set filters such as Billing period, Accounting period, or topmost filters. TIP: You can combine with other filters if you want to refine your results. This filter is incompatible with Flag type.
- Flag status - Filter for bills with a specific flag status. To include all the matching bills do not set other filters such as Billing period, Accounting period, or topmost filters. TIP: You can combine with other filters if you want to refine your results.
- Flag type - Filter for bills with one or more flag types. To include all the matching bills do not set filters such as Billing period, Accounting period, or topmost filters. TIP: You can combine with other filters if you want to refine your results. This filter is incompatible with Flag issue.
- Flag unassigned - Filter for bills where the flag is unassigned. To include all the matching bills do not set other filters such as Date range, Accounting period, or topmost filters. TIP: You can combine with other filters if you want to refine your results.
- Meter group - Lets you filter the report to a specific group of meters.
- Topmost cost center code - When you use this filter you are selecting the topmost cost center you want to be included. When you set a topmost cost center it is the highest level of the accounting tree used, this lets you select a subset of data for reporting.
- Topmost cost center name - When you use this filter you are selecting the topmost cost center you want to be included. When you set a topmost cost center it is the highest level of the accounting tree used, this lets you select a subset of data for reporting.
- Topmost place code - Select the topmost organization or site you want to be included. When you set a topmost organization or site it is the highest level of the facilities tree used, this lets you select a subset of data from your tree for reporting.
- Topmost place name - Select the topmost organization or site you want to be included. When you set a topmost organization or site it is the highest level of the facilities tree used, this lets you select a subset of data from your tree for reporting.
- Vendor code - Filter by one or more vendors, to see all vendors do not include a topmost or group filter. You can combine with other filters if you want to refine your results.
- Vendor name - Filter by one or more vendors, to see all vendors do not include a topmost or group filter. You can combine with other filters if you want to refine your results.
Optional Filters
- Account name - Filter for one or more accounts. This filter is not compatible with topmost or group filters.
- Accounting period - Filter to one or more accounting periods. This filter is not compatible with the date range filter.
- Accounts in cost center code - Filter to include accounts directly under one or more cost centers. To see all the accounts at a certain level in your hierarchy use the Topmost cost center filter. This filter is not compatible with other topmost or group filters.
- Accounts in cost center name - Filter to include accounts directly under one or more cost centers. To see all the accounts at a certain level in your hierarchy use the Topmost cost center filter. This filter is not compatible with other topmost or group filters.
- Bill entered by - Filter to one or more bills. To see all the bills do not set a topmost, Date range, or other specific filters.
- Bill entry date - Filter to one or more bills. To see all the bills do not set a topmost, Date range, or other specific filters.
- Bill has been split - Bill splits are configured on the account. This type of chargeback splits the entire bill to destination meters.
- Bill ID - Filter for specific bills, to include all the bills do not set a topmost or group filter. TIP: You can combine with other filters if you want to refine your results.
- Bill is approved - Select approved or not approved bills to include in the report.
- Bill is from external vendor - When this filter is not selected, the report includes data from both vendor (external) and chargeback (internal) bills.
- Exported to AP - Select yes or no.
- Exported to GL - Select yes or no.
- Held from accounting export - Select yes or no.
- Include accrual bills - if this filter is not included the report includes accrual bills.
- Meters in site code - Filter to include meters directly under one or more sites. TIP: To see all the meters at a certain level in your hierarchy use the Topmost place filter. This filter is not compatible with other topmost or group filters.
- Meters in site name - Filter to include meters directly under one or more sites. TIP: To see all the meters at a certain level in your hierarchy use the Topmost place filter. This filter is not compatible with other topmost or group filters.
- Rate schedule - Filter to one or more rate schedules, to see all results do not include a topmost or group filter. TIP: You can combine with a topmost filter to further refine your results.
- Site group - Filter for specific groups. To include all group members, do not set a topmost filter. TIP: You can combine with other filters if you want to refine your results.