Report-13
Last updated May 13, 2026
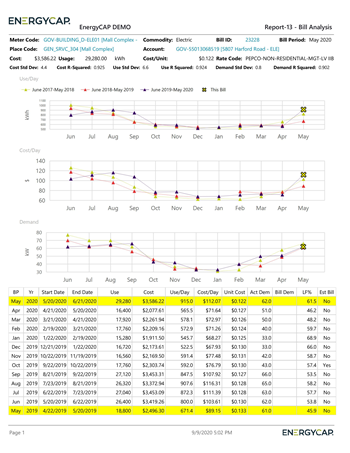
Bill Analysis
The Bill Analysis report helps you identify and investigate abnormal bills using both line charts and a data table.
This report differs from Report-12 in that you can set the Outlier analysis sensitivity filter to Severe, High, Moderate, or all bills for the time frame selected.
What it does
- Line Charts: Show trends in use, cost, demand, or unit cost so you can visually spot anything that looks unusual.
- Outlier Detection: The report uses a quadratic regression formula to automatically highlight bills that fall outside of expected patterns—these are your potential outliers.
- Detailed Data Table:
- Displays one page per bill, making it easy to focus on each case.
- Includes historical billing data to help you compare and decide if the bill truly looks incorrect or just slightly different.
Why use Report-13?
- Quickly flag bills that may be errors or need review.
- Back up your findings with chart visuals and supporting historical data.
- Save time by focusing only on bills that are likely to need action.
Report-13 is available as: PDF, Excel
Report-13: Recommendations for Use
Report-13 is built to help you audit recently entered bills. To get the most relevant and useful results, follow these tips when setting up the report:
1. Focus on Recent Bills
Because this report is designed to catch issues in current billing data, you should set one of the following filters:
- Billing Period: Choose a recent month.
- Batch: Select a recent batch of bills.
- Bill Entry Date: Filter for bills recently entered into the system.
This ensures you're reviewing the most up-to-date bills for potential issues.
2. Set Outlier Sensitivity
Use the Outlier analysis sensitivity filter to control how strict the report is when identifying potential issues:
- Severe Only: Shows only the most probable or extreme problems.
- High and Moderate: Loosens the criteria to catch more possible issues, even if they're not as critical.
Pick the setting that matches how thorough you want the review to be.
3. Choose What to Analyze
Use the Value analyzed for outliers filter to decide which bill values should be checked for irregularities:
- Use
- Cost
- Demand
- Or any combination of these three
Select what’s most relevant for your audit goals.
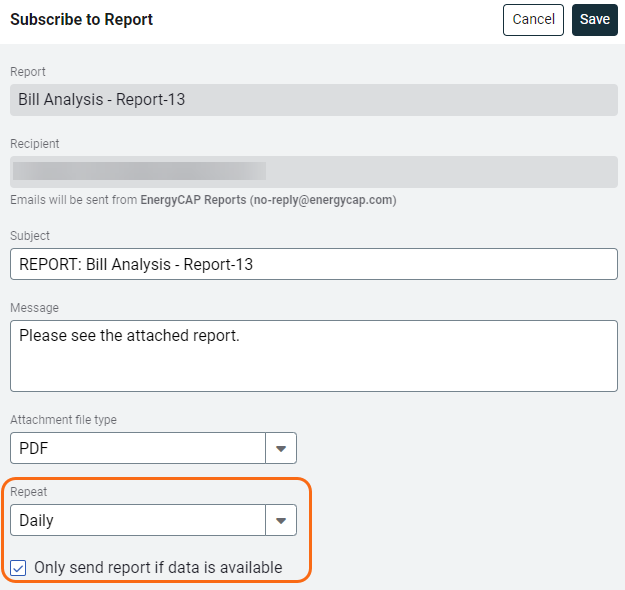
Report-13 tip
You can subscribe to Report-13 to get emails when problematic bills are entered. Configure the report and subscribe to the report. Use the option to Only send report if data is available.

Set your filters for Report-13
- Active accounts only
Decide whether to include only active accounts.
If this filter is not applied, your report includes both active and inactive accounts. - Void bills
Include if you want a full audit history.
Exclude to focus only on valid financial activity. - Number of comparison years
Choose how many past years to include. - Outlier analysis sensitivity
Adjusts how sensitive the system is to detecting unusual bills. - Value analyzed for outliers
Set the values you want analyzed to determine if the bill is an outlier.
Other filters to consider for Report-13
- Limit the size of the report
Set the Billing period, Batch, or Entry date. - Cost
Reduce the report size by filtering out low-cost bills that may not need review.
Available filters for Report-13
Required filters
- Account is active - If this filter is not included, both active and inactive accounts are included in the report.
- Bill is void - If this filter is not included both void and not void are included.
- Number of comparison years - Number of historical years to use for comparison to the current bill.
- Outlier analysis sensitivity - Decide what potential problem bills to include, select (Severe Only) to report on the most likely problems or be more sensitive (and less restrictive) and include High or Moderate problems.
- Value analyzed for outliers - Select one or more values you want to analyze.
Recommended filters
- Account number - Filter for one or more accounts. This filter is not compatible with topmost or group filters.
- Batch - Filter to include bills from one or more batches, to include all the bills in the batch, do not set a topmost, Date range, or other specific filters. TIP: You can combine with other filters if you want to refine your results.
- Billing period - It’s recommended to select a recent month, batch, or set the bill entry date to bills that were recently entered.
- Commodity - Select one or more commodities to include in the report. This filter is not compatible with the commodity category filter.
- Commodity category - Select one or more categories to include in the report. Groups commodities into broader categories such as Electric or Gas. Use when you want to roll up all commodities within a category rather than selecting individual ones. Not compatible with the Commodity filter.
- Cost - Filter to one or more bills based on cost. To see all the bills, do not set a topmost, date range, or other specific filters.
- Meter group - Filter for specific groups. To include all group members, do not set a topmost filter. TIP: You can combine with other filters if you want to refine your results.
- Topmost cost center code - When you use this filter you are selecting the topmost cost center you want to be included. When you set a topmost cost center it is the highest level of the accounting tree used, this lets you select a subset of data for reporting.
- Topmost cost center name - When you use this filter you are selecting the topmost cost center you want to be included. When you set a topmost cost center it is the highest level of the accounting tree used, this lets you select a subset of data for reporting.
- Topmost place code - Select the topmost organization or site you want to be included. When you set a topmost organization or site it is the highest level of the facilities tree used, this lets you select a subset of data from your tree for reporting.
- Topmost place name - Select the topmost organization or site you want to be included. When you set a topmost organization or site it is the highest level of the facilities tree used, this lets you select a subset of data from your tree for reporting.
- Vendor code - Filter by one or more vendors, to see all vendors do not include a topmost or group filter. You can combine with other filters if you want to refine your results.
- Vendor name - Filter by one or more vendors, to see all vendors do not include a topmost or group filter. You can combine with other filters if you want to refine your results.
Optional Filters
- Account name - Filter for one or more accounts. This filter is not compatible with topmost or group filters.
- Accounting period - Filter to one or more accounting periods. This filter is not compatible with the date range filter.
- Accounts in cost center code - Filter to include accounts directly under one or more cost centers. To see all the accounts at a certain level in your hierarchy use the Topmost cost center filter. This filter is not compatible with other topmost or group filters.
- Accounts in cost center name - Filter to include accounts directly under one or more cost centers. To see all the accounts at a certain level in your hierarchy use the Topmost cost center filter. This filter is not compatible with other topmost or group filters.
- Bill entered by - Filter to one or more bills. To see all the bills do not set a topmost, Date range, or other specific filters.
- Bill entry date - Filter to one or more bills. To see all the bills do not set a topmost, Date range, or other specific filters.
- Bill has been split - Bill splits are configured on the account. This type of chargeback splits the entire bill to destination meters.
- Bill ID - Filter for specific bills, to include all the bills do not set a topmost or group filter. TIP: You can combine with other filters if you want to refine your results.
- Bill is approved - Select approved or not approved bills to include in the report.
- Bill is from external vendor - When this filter is not selected, the report includes data from both vendor (external) and chargeback (internal) bills.
- Exported to AP - Select yes or no.
- Exported to GL - Select yes or no.
- Held from accounting export - Select yes or no.
- Include accrual bills - if this filter is not included the report includes accrual bills.
- Include reversed accrual bills - Select yes or no to include reversed accrual bills in the report.
- Meters in site code - Filter to include meters directly under one or more sites. TIP: To see all the meters at a certain level in your hierarchy use the Topmost place filter. This filter is not compatible with other topmost or group filters.
- Meters in site name - Filter to include meters directly under one or more sites. TIP: To see all the meters at a certain level in your hierarchy use the Topmost place filter. This filter is not compatible with other topmost or group filters.
- Rate schedule - Filter to one or more rate schedules, to see all results do not include a topmost or group filter. TIP: You can combine with a topmost filter to further refine your results.
- Site group - Filter for specific groups. To include all group members, do not set a topmost filter. TIP: You can combine with other filters if you want to refine your results.