Report-19
Last updated May 13, 2026
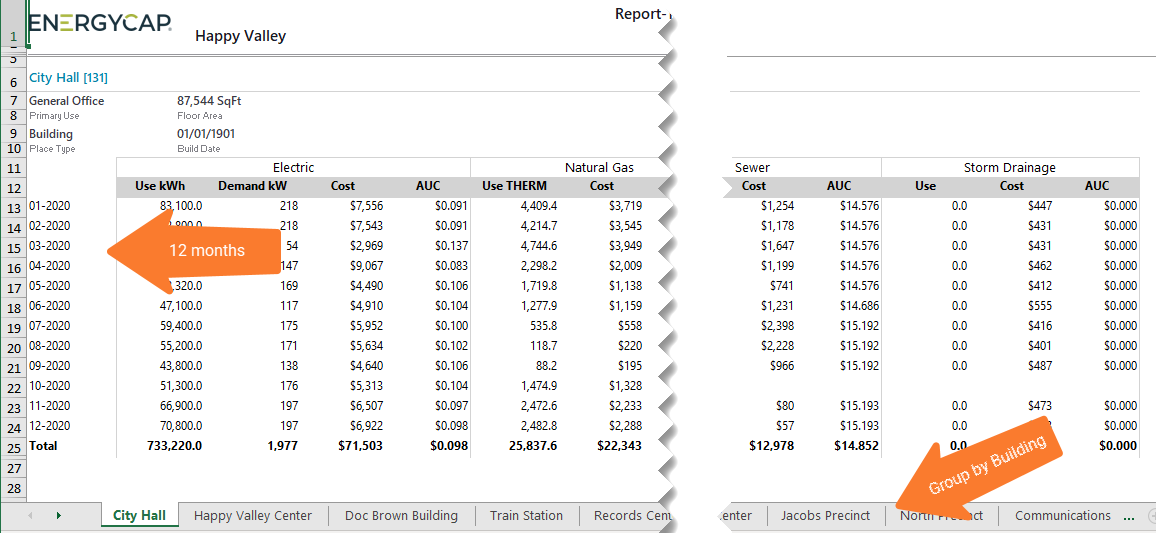
Monthly Utility Use and Cost (Excel only)
Report-19 provides an Excel spreadsheet of monthly use, demand, cost, and average unit cost (AUC). It’s commonly used as an annual building report to analyze monthly and yearly trends.
Without the Group by filter, the report generates a one-page executive summary.
With the Group by filter, the report creates one tab per selected object.
Group by options
- Account
- Cost center
- Meter
- Organization
- Site
- Vendor
Commodity filter
Use the Commodity filter to focus on a specific utility.
Without it, the report includes all commodities, each with its own total row.
What the report shows
- Monthly use
- Demand
- Cost
- Average unit cost (AUC)
- Totals by commodity
Note: This report does not include area or cost per area.
What it’s used for
Use this report to:
- Analyze monthly and yearly utility trends.
- Create annual building performance reports.
- Compare use and cost across time or groups.
- Review commodity-level totals in Excel for further analysis.
Report-19 is available as: Excel and Excel data only
Example uses
- Show use for a date range per commodity per site or cost center.
- Show monthly use and cost by commodity for specific meters.
- Show monthly comparison of commodity categories.

Report-19 tip
By default, this is a one-page summary report, add Group by to have one tab for each object (site, account, etc.).
Set your filters for Report-19
- In the Data type field, choose the data set you want to use for the report.
Data set When to use it Why it helps Billing Period Accounting, chargebacks, or any task that needs the exact bill dates Uses the raw start and end dates from the utility bill Calendarized Month-to-month or year-over-year analysis of cost and usage Spreads each bill across true calendar months so totals line up with financial periods. Displays both use and cost. Normalized Year-over-year usage analysis Adjusts energy use for weather, removing temperature as a variable - End period
This sets the end month for the report. - Number of months
Sets the number of months in the report. - Number of years
Select the number of years to include.
Other filters to consider for Report-19
- Group by
To have one spreadsheet tab per object. - Commodities
If you don't add this filter, all the commodities are in your report. Use the Commodity category filter to view more granular commodity data in charts and reports. - Active accounts only
Decide whether to include only active accounts.
If this filter is not applied, your report includes both active and inactive accounts. -
Chargebacks or Vendor Bills
Use the Bill is from external vendor filter:
- Select Yes to show only vendor bills.
- Select No to show only chargeback bills.
- Do not include the filter both vendor and chargeback bills.
- Void bills
Include if you want a full audit history.
Exclude to focus only on valid financial activity.
Example filters for Report-19
A quarterly report for the last 2 years.


One year report with different buildings on each tab.

Available filters for Report-19
Required filters
- Data type - Select the type of data for the report, billing period, calendarized, or normalized.
- End period - Set the end period for the report.
- Number of months(1-13) - Select the number of months you want to report on.
- Number of years - Select how many years you want in the report: 1, 2, or 3.
Recommended filters
- Bill is void - If this filter is not included both void and not void are included.
- Group by - By default this is a one page executive summary. TIP: Select Sites to create a multiple page report with one site per page.
- Topmost place code - Select the topmost organization or site you want to be included. When you set a topmost organization or site it is the highest level of the facilities tree used, this lets you select a subset of data from your tree for reporting.
- Topmost place name - Select the topmost organization or site you want to be included. When you set a topmost organization or site it is the highest level of the facilities tree used, this lets you select a subset of data from your tree for reporting.
Optional Filters
- Account is active - If this filter is not included, both active and inactive accounts are included in the report.
- Account name - Filter to one or more accounts. This filter is not compatible with topmost or group filters.
- Account number - Filter to one or more accounts. This filter is not compatible with topmost or group filters.
- Bill is from external vendor - When this filter is not selected, the report includes data from both vendor (external) and chargeback (internal) bills.
- Commodity - Filter to one or more commodities. This filter is not compatible with the commodity category filter.
- Commodity category - Filter to one or more commodity categories. Groups commodities into broader categories such as Electric or Gas. Use when you want to roll up all commodities within a category rather than selecting individual ones. Not compatible with the Commodity filter.
- Meter code - Filter to one or more meters. This filter is not compatible with topmost filters.
- Meter group - Filter for specific groups. To include all group members, do not set a topmost filter. TIP: You can combine with other filters if you want to refine your results.
- Meter name - Filter to include one or more meters. This filter is not compatible with topmost or group filters.
- Meters in site code - Filter to include meters directly under one or more sites. TIP: To see all the meters at a certain level in your hierarchy use the Topmost place filter. This filter is not compatible with other topmost or group filters.
- Meters in site name - Filter to include meters directly under one or more sites. TIP: To see all the meters at a certain level in your hierarchy use the Topmost place filter. This filter is not compatible with other topmost or group filters.
- Site group - Filter for specific groups. To include all group members, do not set a topmost filter. TIP: You can combine with other filters if you want to refine your results.
- Topmost place code - Select the topmost organization or site you want to be included. When you set a topmost organization or site it is the highest level of the facilities tree used, this lets you select a subset of data from your tree for reporting.
- Topmost place name - Select the topmost organization or site you want to be included. When you set a topmost organization or site it is the highest level of the facilities tree used, this lets you select a subset of data from your tree for reporting.
- Vendor code - Filter by one or more vendors, to see all vendors do not include a topmost or group filter. You can combine with other filters if you want to refine your results.
- Vendor name - Filter by one or more vendors, to see all vendors do not include a topmost or group filter. You can combine with other filters if you want to refine your results.