Report-21
Last updated May 11, 2026
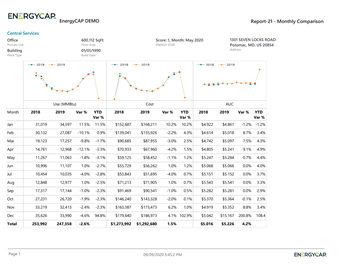
Monthly Comparison
This report displays three line charts with data tables to compare use, cost, demand, and AUC across two selected years. Yellow highlights draw attention to variances from the base year.
What the report shows
-
Monthly data for two years:
- Use
- Cost
- Demand
- Average Unit Cost (AUC)
- Totals for each year
- Variance percentage between the two years
- Line charts to visualize patterns and outliers
- Option to group by site, meter, cost center, and more
- Ability to select one or more commodities
Why it’s useful
Use this report to:
- Compare year-over-year performance
- Spot trends and patterns quickly
- Identify outliers using variance highlighting
- Customize thresholds to highlight specific variances
Report format
- One-page summary by default
- Add the Group by filter to create one page per object
Report-21 is available as: PDF, Excel
Demand Reporting in Report-21
If your report includes meters with mixed units of measure for demand, only one demand type is shown in the report. Demand cost is not included in Report-21.
Report-21 Recommendations
Set a variance threshold and have the report automatically highlight abnormal results.
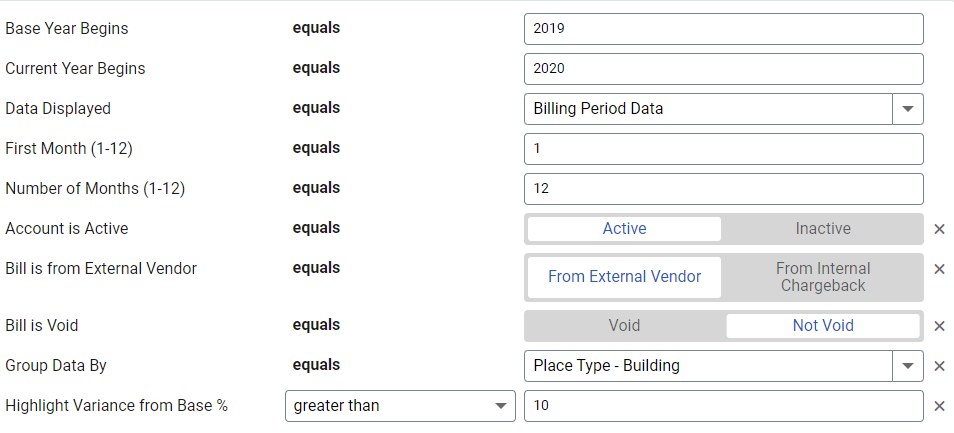
Set your filters for Report-21
- Set your Base year.
- Set your Current year.
- In the Data type field, choose the data set you want to use for the report.
Data set When to use it Why it helps Billing Period Accounting, chargebacks, or any task that needs the exact bill dates Uses the raw start and end dates from the utility bill Calendarized Month-to-month or year-over-year analysis of cost and usage Spreads each bill across true calendar months so totals line up with financial periods. Displays both use and cost. Normalized Year-over-year usage analysis Adjusts energy use for weather, removing temperature as a variable - First month
Select the month you want the report to start with. - Number of months
Sets the number of months for each column. Enter 3 for a quarterly report or 12 for a full year report.
Other filters to consider for Report-21
- Active accounts only
Decide whether to include only active accounts.
If this filter is not applied, your report includes both active and inactive accounts. -
Chargebacks or Vendor Bills
Use the Bill is from external vendor filter:
- Select Yes to show only vendor bills.
- Select No to show only chargeback bills.
- Do not include the filter both vendor and chargeback bills.
- Void bills
Include if you want a full audit history.
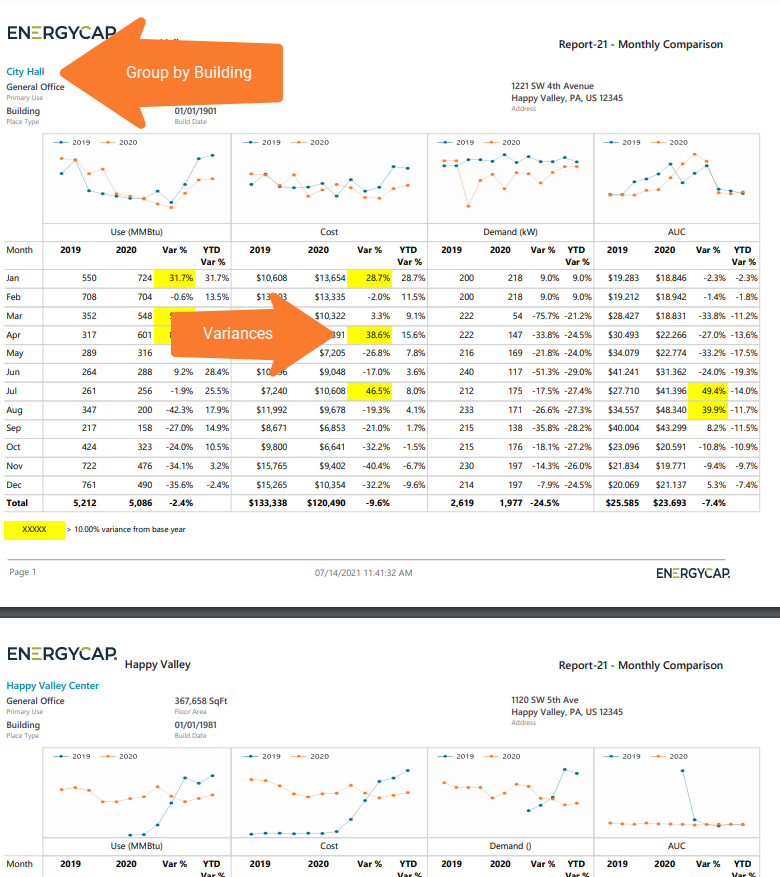
Exclude to focus only on valid financial activity. - Group by
Do you want a report for each building or meter or a one-page executive summary report?- Without the filter Group by the report is a one page summary.
- If you set your topmost to an organization you can group by building and have one chart or data table per building.
Example filters for Report-21
A one page executive summary of your organization comparing 2019 to 2020.


Building report with variances greater than 10% highlights.
Available filters for Report-21
Required filters
- Base year - One of the two years you want to compare in the report.
- Current year - One of the two years you want to compare in the report.
- Data type - Select the type of data you want to use in the report, billing period, calendarized, or normalized.
- First month - Select the starting month (1 thru 12), this is a calendar month not a fiscal month.
- Number of months(1-12) - Set the number of months to include in the report.
Recommended filters
- Bill is void - If this filter is not included both void and not void are included.
- Commodity - Select one or more commodities to include in the report. Not compatible with the commodity category filter.
- Commodity category - Select one or more commodity categories to include in the report. Not compatible with the commodity filter.
- Group by - By default this is a one page executive summary. TIP: Select Sites to create a multiple page report with one site per page.
- Highlight variance from base % - Enter a numeric value. TIP: For example, consider using greater than to automatically highlight months that are greater than the variance number you entered.
- Topmost cost center code - When you use this filter you are selecting the topmost cost center you want to be included. When you set a topmost cost center it is the highest level of the accounting tree used, this lets you select a subset of data for reporting.
- Topmost cost center name - When you use this filter you are selecting the topmost cost center you want to be included. When you set a topmost cost center it is the highest level of the accounting tree used, this lets you select a subset of data for reporting.
- Topmost place code - Select the topmost organization or site you want to be included. When you set a topmost organization or site it is the highest level of the facilities tree used, this lets you select a subset of data from your tree for reporting.
- Topmost place name - Select the topmost organization or site you want to be included. When you set a topmost organization or site it is the highest level of the facilities tree used, this lets you select a subset of data from your tree for reporting.
Optional Filters
- Account is active - If this filter is not included, both active and inactive accounts are included in the report.
- Account name - Filter for one or more accounts. This filter is not compatible with topmost or group filters.
- Account number - Filter for one or more accounts. This filter is not compatible with topmost or group filters.
- Bill is from external vendor - When this filter is not selected, the report includes data from both vendor (external) and chargeback (internal) bills.
- Include accrual bills - If not included, includes accrual bills.
- Include reversed accrual bills - Select yes or no.
- Meter code - Filter to one or more meters. This filter is not compatible with topmost filters.
- Meter group - Filter for specific groups. To include all group members, do not set a topmost filter. TIP: You can combine with other filters if you want to refine your results.
- Meters in site code - Filter to include meters directly under one or more sites. TIP: To see all the meters at a certain level in your hierarchy use the Topmost place filter. This filter is not compatible with other topmost or group filters.
- Meters in site name - Filter to include meters directly under one or more sites. TIP: To see all the meters at a certain level in your hierarchy use the Topmost place filter. This filter is not compatible with other topmost or group filters.
- Rate schedule - Filter to one or more rate schedules, to see all results do not include a topmost or group filter. TIP: You can combine with a topmost filter to further refine your results.
- Site group - Filter for specific groups. To include all group members, do not set a topmost filter. TIP: You can combine with other filters if you want to refine your results.
- Vendor code - Filter by one or more vendors, to see all vendors do not include a topmost or group filter. You can combine with other filters if you want to refine your results.
- Vendor name - Filter by one or more vendors, to see all vendors do not include a topmost or group filter. You can combine with other filters if you want to refine your results.