Report-22
Last updated May 11, 2026
Monthly Building Manager Report
This report provides a comprehensive, single-page view of building performance with pie, bar, and line charts supported by detailed data.
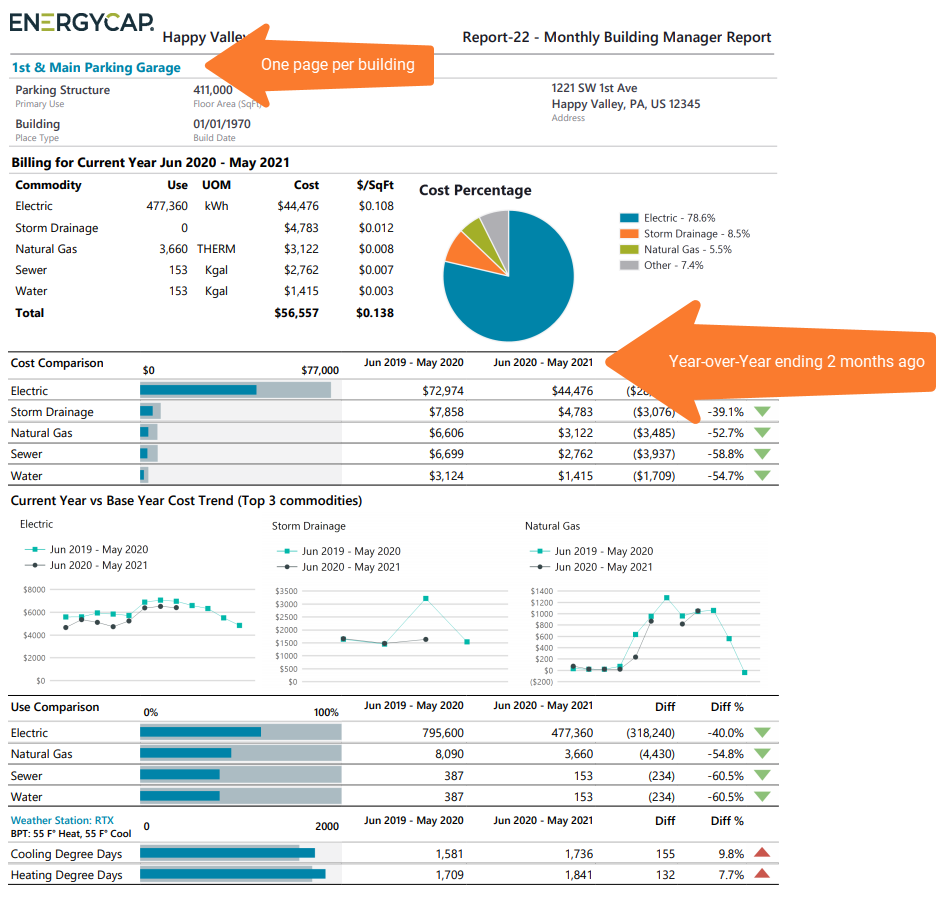
By default, it displays a one-page summary. Use the Group by filter to generate one page per object. Use Group by set to Sites to see one page for each site.
What the report shows
The report includes four sections:
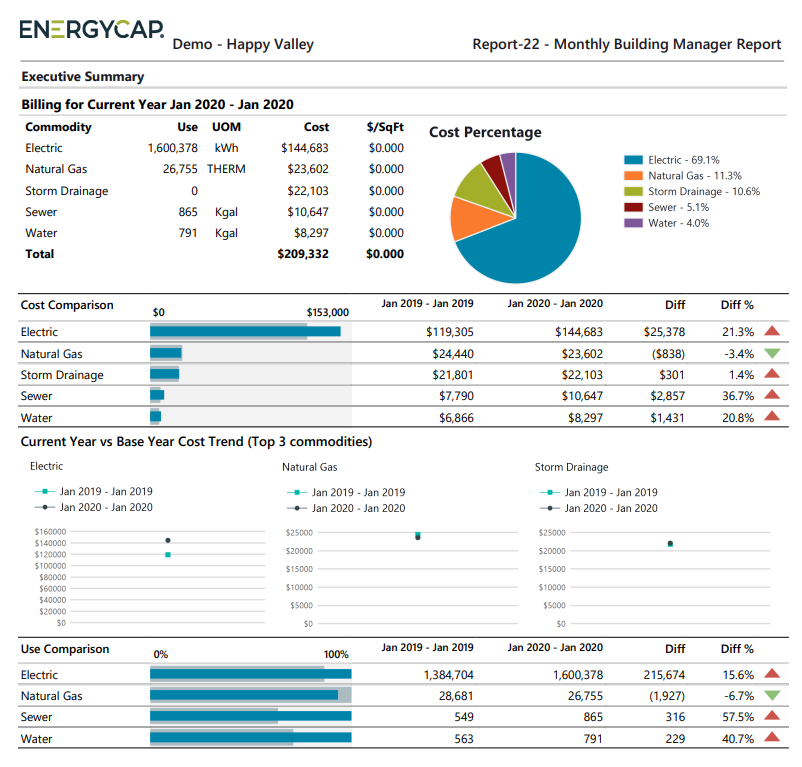
Section 1: Commodity Summary
- Table and pie chart showing:
- Use and cost by commodity
- Total cost across all commodities
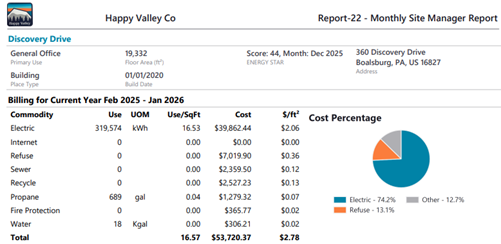
- Bar chart for quick comparison
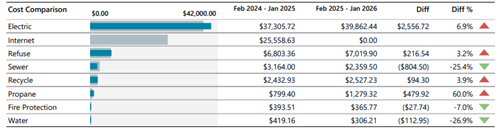
- Table showing:
- Cost for each year
- Difference and percentage change
- Red and green arrows to highlight trends
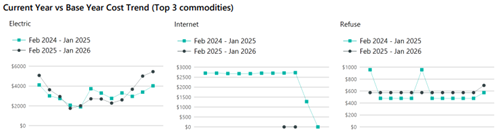
- Line charts comparing year-over-year performance for the top three commodities
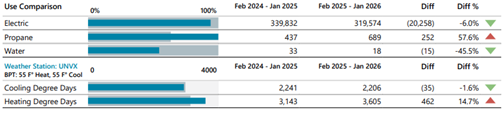
- Similar to Section 2, but focused on use instead of cost
Why it’s useful
Use this report to:
- Get a complete view of site performance in one place
- Compare cost and use across two years
- Quickly interpret data with visual charts
- Support building managers in reviewing and improving performance
Report-22 is available as: PDF, Excel

Report-22 tip
You can configure the filter Rolling year-over-year instead of manually configuring the years and months and then use report subscription to automatically have an up-to-date report emailed to you each month.
Set your filters for Report-22
Option 1
- Set the Base Year.
- Set the Current Year.
- In the Data type field, choose the data set you want to use for the report.
Data set When to use it Why it helps Billing Period Accounting, chargebacks, or any task that needs the exact bill dates Uses the raw start and end dates from the utility bill Calendarized Month-to-month or year-over-year analysis of cost and usage Spreads each bill across true calendar months so totals line up with financial periods. Displays both use and cost. Normalized Year-over-year usage analysis Adjusts energy use for weather, removing temperature as a variable - First month
Set the month you want the report to start with. - Number of months
Sets the number of months per year in the report. - Value
Set the value for the report.
Option 2
Set the Rolling year-over-year filter. This is useful with report distribution and subscription.
Other filters to consider for Report-22
- Active accounts only
Decide whether to include only active accounts.
If this filter is not applied, your report includes both active and inactive accounts. - Void bills
Include if you want a full audit history.
Exclude to focus only on valid financial activity. -
Chargebacks or Vendor Bills
Use the Bill is from external vendor filter:
- Select Yes to show only vendor bills.
- Select No to show only chargeback bills.
- Do not include the filter both vendor and chargeback bills.
- Group by
Do you want a report for each building or meter or a one-page executive summary report?- Without the filter Group by the report is a one page summary.
- If you set your topmost to an organization you can group by building and have one chart or data table per building.
Example filters for Report-22
One page executive summary comparing 2019 and 2020.

Building report using Rolling year-over-year.

Available filters for Report-22
Required filters
- Base year (option 1) -
You have two options for setting the time period for this report.
Option 1 Use these filters together to set the time period you want: Base year, Current year, First month, Number of months.
Option 2 Use Rolling year-over-year filter. (Useful with report distribution and subscription.)
When you use Option 2, it OVERRIDES anything set for option 1. - Current year (option 1) -
You have two options for setting the time period for this report.
Option 1 Use these filters together to set the time period you want: Base year, Current year, First month, Number of months.
Option 2 Use Rolling year-over-year filter. (Useful with report distribution and subscription.)
When you use Option 2, it OVERRIDES anything set for option 1. - Data type - Select billing period, calendarized, or normalized.
- First month (1-12) (option 1) -
- Number of months (1-12) (option 1)
- Value - Select the value to report on.
Recommended filters
- Bill is void - If this filter is not included both void and not void are included.
- Commodity - Select one or more commodities to include in the report. Not compatible with commodity category.
- Commodity category - Select one or more commodity categories to include in the report. Not compatible with the commodity filter.
- Group by - Without the filter the report is a one page summary report.
- Rolling year-over-year (option 2) - Select either Year over year ending 2 months ago or Year over year ending 3 months ago.
- Topmost cost center code - When you use this filter you are selecting the topmost cost center you want to be included. When you set a topmost cost center it is the highest level of the accounting tree used, this lets you select a subset of data for reporting.
- Topmost cost center name - When you use this filter you are selecting the topmost cost center you want to be included. When you set a topmost cost center it is the highest level of the accounting tree used, this lets you select a subset of data for reporting.
- Topmost place code - Select the topmost organization or site you want to be included. When you set a topmost organization or site it is the highest level of the facilities tree used, this lets you select a subset of data from your tree for reporting.
- Topmost place name - Select the topmost organization or site you want to be included. When you set a topmost organization or site it is the highest level of the facilities tree used, this lets you select a subset of data from your tree for reporting.
Optional Filters
- Account is active - If this filter is not included, both active and inactive accounts are included in the report.
- Account name - Filter for one or more accounts. This filter is not compatible with topmost or group filters.
- Account number - Filter for one or more accounts. This filter is not compatible with topmost or group filters.
- Bill is from external vendor - When this filter is not selected, the report includes data from both vendor (external) and chargeback (internal) bills.
- Include accrual bills - Select yes or no. If not used, accrual bills are included.
- Include reversed accrual bills - Select yes or no.
- Meter code - Filter to one or more meters. This filter is not compatible with topmost filters.
- Meter group - Filter for specific groups. To include all group members, do not set a topmost filter. TIP: You can combine with other filters if you want to refine your results.
- Meter name - Filter to include one or more meters. This filter is not compatible with topmost or group filters.
- Meters in site code - Filter to include meters directly under one or more sites. TIP: To see all the meters at a certain level in your hierarchy use the Topmost place filter. This filter is not compatible with other topmost or group filters.
- Meters in site name - Filter to include meters directly under one or more sites. TIP: To see all the meters at a certain level in your hierarchy use the Topmost place filter. This filter is not compatible with other topmost or group filters.
- Rate schedule - Filter to one or more rate schedules, to see all results do not include a topmost or group filter. TIP: You can combine with a topmost filter to further refine your results.
- Site group - Filter for specific groups. To include all group members, do not set a topmost filter. TIP: You can combine with other filters if you want to refine your results.
- Vendor code - Filter by one or more vendors, to see all vendors do not include a topmost or group filter. You can combine with other filters if you want to refine your results.
- Vendor name - Filter by one or more vendors, to see all vendors do not include a topmost or group filter. You can combine with other filters if you want to refine your results.