Report-23
Last updated April 30, 2026
Energy Conservation Program Results
Cost Avoidance and Energy Impact
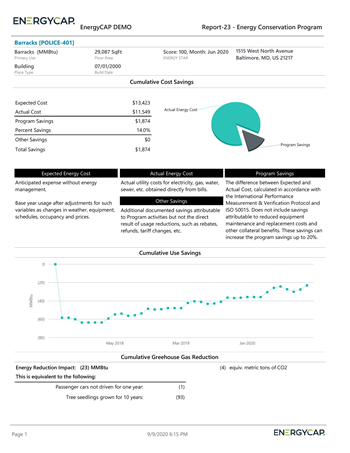
Report-23 uses pie and line charts to summarize the effectiveness of your energy conservation program, including cost avoidance and energy reduction.
Report versions
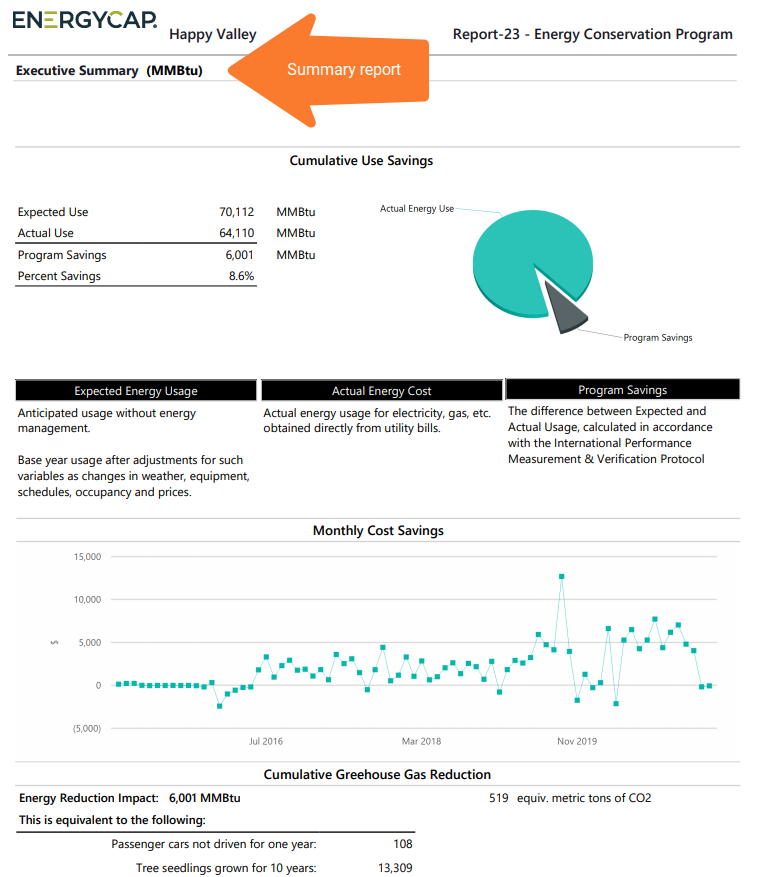
- One page executive summary – Displays all data on a single page (no Group by filter)
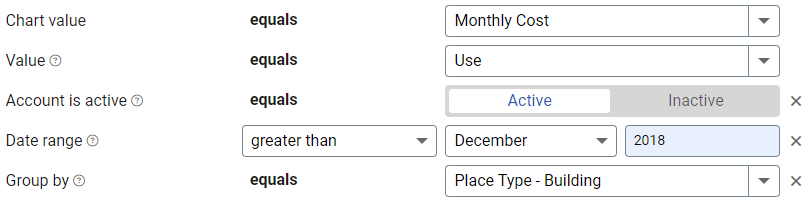
- One page per object – Displays one page for each selected object (Group by filter applied)
Report-23 is available as: PDF, Excel, and Word
What the report shows
- Visual summaries of cost avoidance and energy reduction
- Trends over time using line charts
- Distribution of savings using pie charts
CO₂ equivalent (MTCO₂e)
The equivalent metric tons of CO₂ shown in this report represent the energy reduction impact, not actual emissions saved.
This value translates your energy reduction into environmental impact terms.
How CO₂ reduction is calculated
The calculation is based on:
- Actual Use for the selected time period (shown when Value = Use).
- Actual emissions for the time period (not displayed in the report).
- Avoided Use (Energy Reduction Impact).
Why it’s useful
Use this report to:
- Measure the impact of energy conservation efforts.
- Communicate savings in both cost and environmental terms.
- Visualize trends and progress over time.
Report-23 is available as: PDF, Excel, Word
Report-23 recommendations
Remember to run Cost Avoidance -> Calculate Savings first.

Set your filters for Report-23
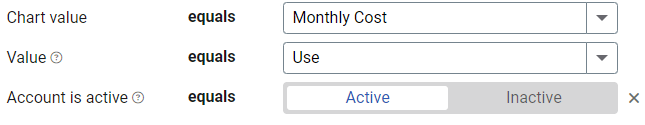
- Set the Chart values.
- Choose what to display with Value.
- If you are tracking Other Savings, use the filter Include Other Savings to include those amounts in the report.
Other filters to consider for Report-23
- Active accounts only
Decide whether to include only active accounts.
If this filter is not applied, your report includes both active and inactive accounts. - Time period
Use the Date range filter to set the reporting period.
Or choose Accounting period—only available when using Billing period data. - Group by
Do you want a report for each building or meter or a one-page executive summary report?- Without the filter Group by the report is a one page summary.
- If you set your topmost to an organization you can group by building and have one chart or data table per building.
Example filters for Report-23
Executive summary report for all time.
Building report from 2019 to current.

Available filters for Report-23
Required filters
- Chart value - Select the value to include in the report: Cumulative cost, cumulative use, monthly cost, monthly use.
- Value - Select either cost or use.
Recommended filters
- Billing period - Set the Billing period to report on. This filter is not compatible with the Accounting period filter.
- Group by - Without this filter the report is an executive summary.
- Include "Other Savings" - Other Savings are one-time or recurring cost reductions that don't fit within the normal cost avoidance calculations. They are still valid savings attributable to energy management activities.
- Market based - Location based emissions are used if this filter is not selected or set to No.
- Site group - Filter for specific groups. To include all group members, do not set a topmost filter. TIP: You can combine with other filters if you want to refine your results.
- Topmost place code - Select the topmost organization or site you want to be included. When you set a topmost organization or site it is the highest level of the facilities tree used, this lets you select a subset of data from your tree for reporting.
- Topmost place name - Select the topmost organization or site you want to be included. When you set a topmost organization or site it is the highest level of the facilities tree used, this lets you select a subset of data from your tree for reporting.
Optional Filters
- Account is active - If this filter is not included, both active and inactive accounts are included in the report.
- Accounting period - Filter to one or more Accounting periods. Not compatible with the Billing period filter.
- Bill is from external vendor - When this filter is not selected, the report includes data from both vendor (external) and chargeback (internal) bills.
- Commodity - Select one or more commodities. Not compatible with Commodity category filter.
- Commodity category - Select one or more commodity categories. Not compatible with the commodity filter.
- Meter code - Filter to one or more meters. This filter is not compatible with topmost filters.
- Meter group - Filter for specific groups. To include all group members, do not set a topmost filter. TIP: You can combine with other filters if you want to refine your results.
- Meter name - Filter to include one or more meters. This filter is not compatible with topmost or group filters.
- Meters in site code - Filter to include meters directly under one or more sites. TIP: To see all the meters at a certain level in your hierarchy use the Topmost place filter. This filter is not compatible with other topmost or group filters.
- Meters in site name - Filter to include meters directly under one or more sites. TIP: To see all the meters at a certain level in your hierarchy use the Topmost place filter. This filter is not compatible with other topmost or group filters.
- Topmost cost center code - When you use this filter you are selecting the topmost cost center you want to be included. When you set a topmost cost center it is the highest level of the accounting tree used, this lets you select a subset of data for reporting.
- Topmost cost center name - When you use this filter you are selecting the topmost cost center you want to be included. When you set a topmost cost center it is the highest level of the accounting tree used, this lets you select a subset of data for reporting.
- Vendor code - Filter by one or more vendors, to see all vendors do not include a topmost or group filter. You can combine with other filters if you want to refine your results.
- Vendor name - Filter by one or more vendors, to see all vendors do not include a topmost or group filter. You can combine with other filters if you want to refine your results.