Report-26
Last updated May 13, 2026
Use and Cost Summary
Report-26 is a flexible, multi-level report that summarizes use, cost, demand (use), and unit cost over a selected time period. It’s commonly used for budgeting, accruals, and procurement analysis.
What the report shows
For each commodity, the report includes:
- Use and unit of measure
- Demand and unit of measure (not demand cost)
- Cost
- Cost per day
- Cost per unit
Additional features:
- Site hyperlinks for quick navigation
- Totals for each commodity
Flexible grouping
This report supports two levels of grouping, allowing you to customize how data is displayed. For example:
- Group by commodity, with rows by site
- Group by site, with rows by meter
Why it’s useful
Use this report to:
- Organize data in the format you need
- View both detailed and summarized information
- Support financial planning and analysis
Report-26 is available as: PDF, Excel, Word
Set your filters for Report-26
- In the Data type field, choose the data set you want to use for the report.
Data set When to use it Why it helps Billing Period Accounting, chargebacks, or any task that needs the exact bill dates Uses the raw start and end dates from the utility bill Calendarized Month-to-month or year-over-year analysis of cost and usage Spreads each bill across true calendar months so totals line up with financial periods. Displays both use and cost. Normalized Year-over-year usage analysis Adjusts energy use for weather, removing temperature as a variable - Group by
This filter groups and provides subtotals for the object you select. You cannot select the same value as the Display details filter. For example, you could have total commodity cost for each site by using Group by = Sites and the Row details = commodity. - Set Row details.
- Active accounts only
Decide whether to include only active accounts.
If this filter is not applied, your report includes both active and inactive accounts.
Other filters to consider for Report-26
- Active accounts only
Decide whether to include only active accounts.
If this filter is not applied, your report includes both active and inactive accounts. - Void bills
Include if you want a full audit history.
Exclude to focus only on valid financial activity. - Date range
Set to equals prior year to see high-level information or prior month to see details.
Example filters for Report-26
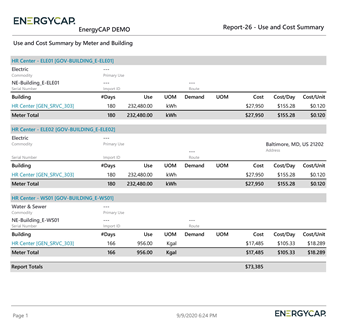
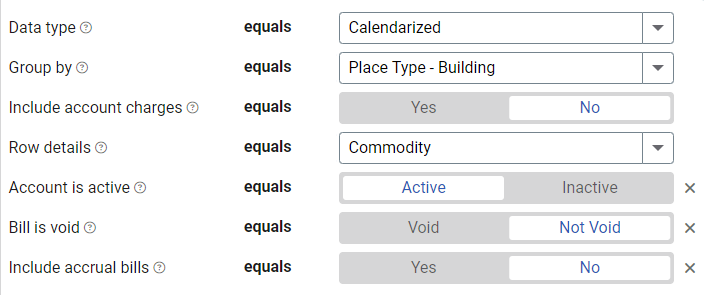
A building report (no time frame specified) listing the use and cost of each commodity.

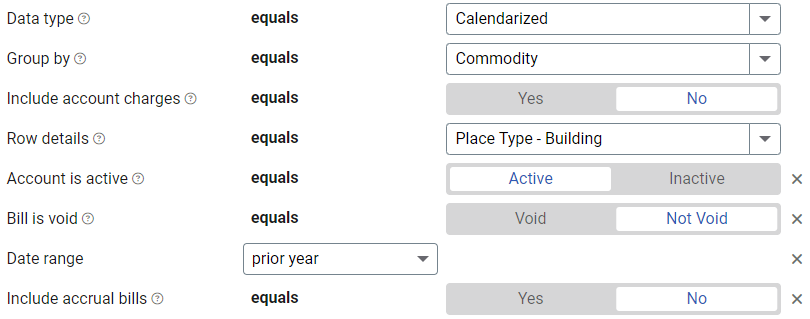
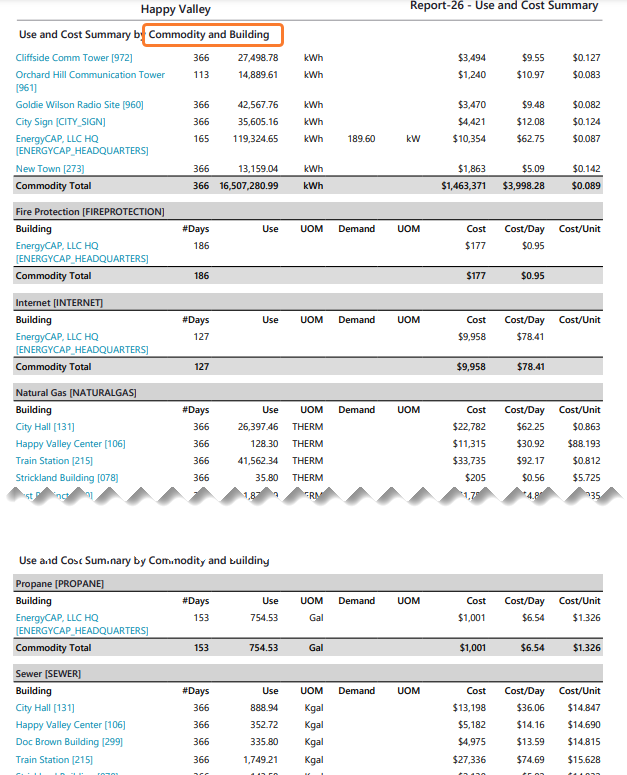
A prior year commodity report listing the use and cost for each building.
Available filters for Report-26
Required filters
- Data type - Select the type of data to report on: billing period, calendarized, or normalized.
- Group by - This filter groups and provides subtotals for the object you select. You cannot select the same value as the Row details filter. For example, you could have total commodity cost for each building by using Group by - Building and then commodity for Row details.
- Include account charges - Account charges are separate from meter charges and not used in calculating unit cost. (For example, late fees, connection charges, or deposits)
- Row details - This filter cannot have the same value as the Group by filter.
Recommended filters
- Accounting period - If you don’t select an Accounting period or Date range, all periods are included. This filter is not compatible with the Date range filter.
- Date range - - If you don’t select an Accounting period or Date range, all periods are included. This filter is not compatible with the Date range filter.
- Meter group - Filter for specific groups. To include all group members, do not set a topmost filter. TIP: You can combine with other filters if you want to refine your results.
- Site group - Filter for specific groups. To include all group members, do not set a topmost filter. TIP: You can combine with other filters if you want to refine your results.
- Topmost cost center code - When you use this filter you are selecting the topmost cost center you want to be included. When you set a topmost cost center it is the highest level of the accounting tree used, this lets you select a subset of data for reporting.
- Topmost cost center name - When you use this filter you are selecting the topmost cost center you want to be included. When you set a topmost cost center it is the highest level of the accounting tree used, this lets you select a subset of data for reporting.
- Topmost place code - Select the topmost organization or site you want to be included. When you set a topmost organization or site it is the highest level of the facilities tree used, this lets you select a subset of data from your tree for reporting.
- Topmost place name - Select the topmost organization or site you want to be included. When you set a topmost organization or site it is the highest level of the facilities tree used, this lets you select a subset of data from your tree for reporting.
Optional Filters
- Account is active - If this filter is not included, both active and inactive accounts are included in the report.
- Account name - Filter for one or more accounts. This filter is not compatible with topmost or group filters.
- Account number - Filter for one or more accounts. This filter is not compatible with topmost or group filters.
- Accounts in cost center code - Filter to include accounts directly under one or more cost centers. To see all the accounts at a certain level in your hierarchy use the Topmost cost center filter. This filter is not compatible with other topmost or group filters.
- Accounts in cost center name - Filter to include accounts directly under one or more cost centers. To see all the accounts at a certain level in your hierarchy use the Topmost cost center filter. This filter is not compatible with other topmost or group filters.
- Bill ID - Filter for specific bills, to include all the bills do not set a topmost or group filter. TIP: You can combine with other filters if you want to refine your results.
- Bill is from external vendor - When this filter is not selected, the report includes data from both vendor (external) and chargeback (internal) bills.
- Bill is void - If this filter is not included both void and not void are included.
- Commodity - Filter to one or more commodities. This filter is not compatible with the commodity category filter.
- Commodity category - Filter to one or more commodity categories. Groups commodities into broader categories such as Electric or Gas. Use when you want to roll up all commodities within a category rather than selecting individual ones. Not compatible with the Commodity filter.
- Include accrual bills - If this filter is not included, the report includes accrual bills.
- Meter code - Filter to include one or more meters. This filter is not compatible with topmost or group filters.
- Meter name - Filter to include one or more meters. This filter is not compatible with topmost or group filters.
- Meters in site code - Filter to include meters directly under one or more sites. TIP: To see all the meters at a certain level in your hierarchy use the Topmost place filter. This filter is not compatible with other topmost or group filters.
- Meters in site name - Filter to include meters directly under one or more sites. TIP: To see all the meters at a certain level in your hierarchy use the Topmost place filter. This filter is not compatible with other topmost or group filters.
- Vendor code - Filter by one or more vendors, to see all vendors do not include a topmost or group filter. You can combine with other filters if you want to refine your results.
- Vendor name - Filter by one or more vendors, to see all vendors do not include a topmost or group filter. You can combine with other filters if you want to refine your results.