Report-35
Last updated April 30, 2026
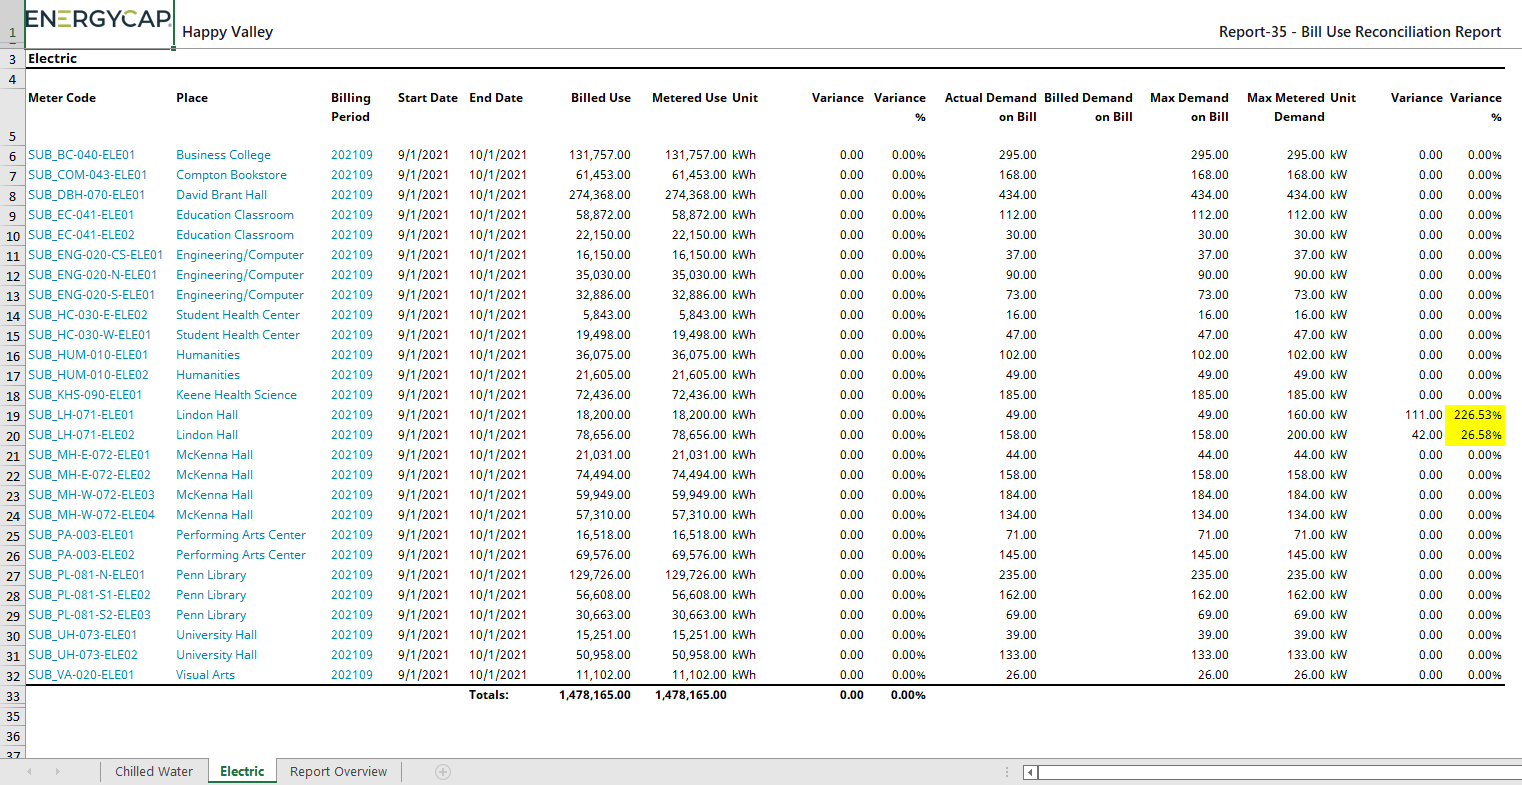
Bill Use Reconciliation Report
This Excel report helps you verify the accuracy of interval data by comparing it to your monthly utility bills.
Key features
- One tab per commodity (for example, electric, gas, water).
- Variance filters highlight outliers for easy review.
- Interval use is summed and converted to monthly totals for side-by-side comparison with the bill.
- If demand data is available:
- Compares interval-based peak demand to billed demand.
Use case
Quickly confirm whether:
- Interval data aligns with billed amounts.
- Any major discrepancies need further investigation.
Report-35 is available as: Excel
Report-30 checks new readings for reasonableness before creating a chargeback bill.
Report-35 tip: understanding use vs. demand variance
-
If a bill shows low Use variance but high Demand variance, it may mean:
- The Billed Demand was set based on a previous month’s peak.
- This is common with tariffs that include a demand ratchet charge penalty.
- ✅ Check your tariff and bill details to confirm if this applies.
Normal variations
- Up to 3% variance is typical due to timing differences.
- EnergyCAP does not track the exact time utility readings are taken.
- Over time, positive and negative variances should balance out.
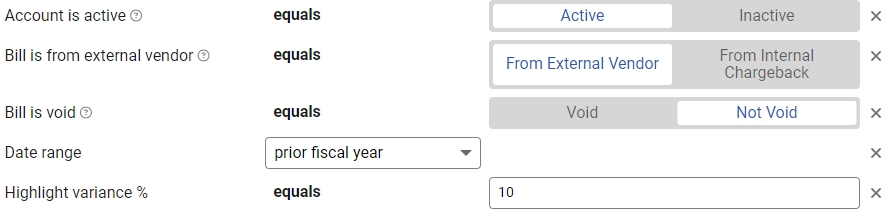
Set your filters for Report-35
- Select the Date range or Accounting period to analyze.
- Set the Highlight variance %. Variations up to 3% are normal.
- Adjust the filter Bill is from external vendor.
Other filters to consider for Report-35
- Active accounts only
Decide whether to include only active accounts.
If this filter is not applied, your report includes both active and inactive accounts. - Void bills
Include if you want a full audit history.
Exclude to focus only on valid financial activity. - View a subset of your data
Use the filter Topmost place or Meter group.
Example
Available filters for Report-35
Recommended filters
- Accounts in cost center code - Filter to include accounts directly under one or more cost centers. TIP: To see all the accounts at a certain level in your hierarchy use the Topmost cost center filter. This filter is not compatible with other topmost or group filters.
- Accounts in cost center name - Filter to include accounts directly under one or more cost centers. TIP: To see all the accounts at a certain level in your hierarchy use the Topmost cost center filter. This filter is not compatible with other topmost or group filters.
- Bill is void - If this filter is not included both void and not void are included.
- Commodity - Select one or more commodities for the report. This filter is not compatible with commodity category.
- Commodity category - Select one or more commodity categories. This filter is not compatible with commodity.
- Date range - Select the date range to include in the report.
- Highlight variance % - Any values greater than the entered value are highlighted.
- Meter group - Filter for specific groups. To include all group members, do not set a topmost filter. TIP: You can combine with other filters if you want to refine your results.
- Topmost place code - Select the topmost organization or site you want to be included. When you set a topmost organization or site it is the highest level of the facilities tree used, this lets you select a subset of data from your tree for reporting.
- Topmost place name- Select the topmost organization or site you want to be included. When you set a topmost organization or site it is the highest level of the facilities tree used, this lets you select a subset of data from your tree for reporting.
Optional Filters
- Account is active - If this filter is not included, both active and inactive accounts are included in the report.
- Accounting period - Select one or more accounting periods.
- Bill has been split - Bill splits are configured on the account. This type of chargeback splits the entire bill to destination meters.
- Bill is approved - Select approved or not approved.
- Bill is from external vendor - When this filter is not selected, the report includes data from both vendor (external) and chargeback (internal) bills.
- Exported to AP - Select yes or no.
- Exported to GL - Select yes or no.
- Held from accounting export - Select yes or no.
- Include accrual bills - If this filter is not included the report includes accrual bills.
- Include reversed accrual bills - Select yes or no.
- Meter code - Filter to one or more meters. Not compatible with topmost filters.
- Meter name - Filter to one or more meters. Not compatible with topmost filters.
- Meter serial number - Filter by one or more meters. To include all results do not set a topmost, group, or other filters.
- Meters in site code - Filter to include meters directly under one or more sites. TIP: To see all the meters at a certain level in your hierarchy use the Topmost place filter. This filter is not compatible with other topmost or group filters.
- Meters in site name - Filter to include meters directly under one or more sites. TIP: To see all the meters at a certain level in your hierarchy use the Topmost place filter. This filter is not compatible with other topmost or group filters.
- Observation method - Select one or more observation methods.
- Vendor code - Filter by one or more vendors, to see all vendors do not include a topmost or group filter. TIP: You can combine with other filters if you want to refine your results.
- Vendor name - Filter by one or more vendors, to see all vendors do not include a topmost or group filter. TIP: You can combine with other filters if you want to refine your results.