Report-40
Last updated April 30, 2026
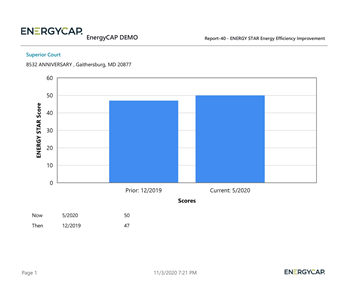
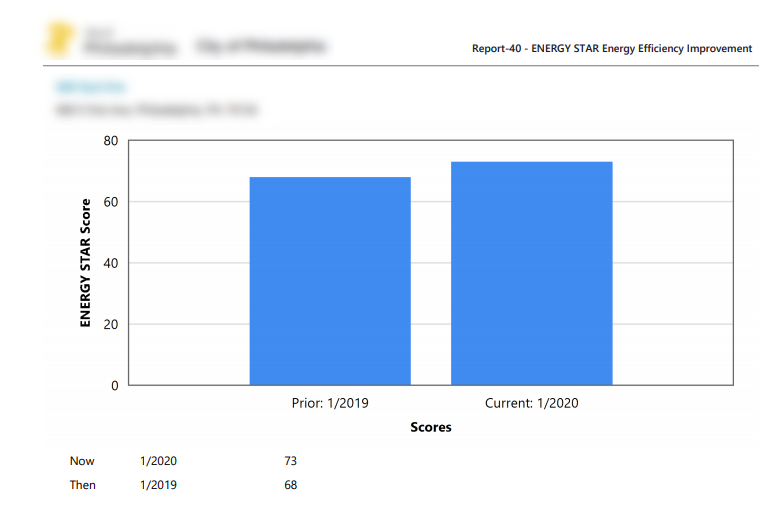
ENERGY STAR Energy Efficiency Improvement
A bar graph for two ENERGY STAR scores with one page per site, illustrating the change in scores over time. If no time period is defined, the earliest and latest ENERGY STAR scores are shown.
Report-40 is available as: PDF, Excel
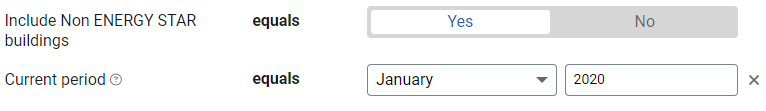
Set your filters for Report-40
- Include Non ENERGY STAR buildings
Set this to NO to see only ENERGY STAR buildings. - Current period
If you only set the current month and year the report compares against the previous year. - Prior period
Set the prior period to compare against.
Example filters for Report-40
Available filters for Report-40
Required filters
- Include non ENERGY STAR sites - select yes or no.
Recommended filters
- Current period - If you only set the Current period the report compares against the previous year. If not set, the earliest and latest scores are reported.
- Prior period - If the Current period and Prior period are not set, the earliest and latest scores are reported.
Optional Filters
- Meters in site code - Filter to include meters directly under one or more sites. TIP: To see all the meters at a certain level in your hierarchy use the Topmost place filter. This filter is not compatible with other topmost or group filters.
- Meters in site name - Filter to include meters directly under one or more sites. TIP: To see all the meters at a certain level in your hierarchy use the Topmost place filter. This filter is not compatible with other topmost or group filters.
- Site group - Filter for specific groups. To include all group members, do not set a topmost filter. TIP: You can combine with other filters if you want to refine your results.
- Topmost place code - Select the topmost organization or site you want to be included. When you set a topmost organization or site it is the highest level of the facilities tree used, this lets you select a subset of data from your tree for reporting.
- Topmost place name- Select the topmost organization or site you want to be included. When you set a topmost organization or site it is the highest level of the facilities tree used, this lets you select a subset of data from your tree for reporting.