Maps overview
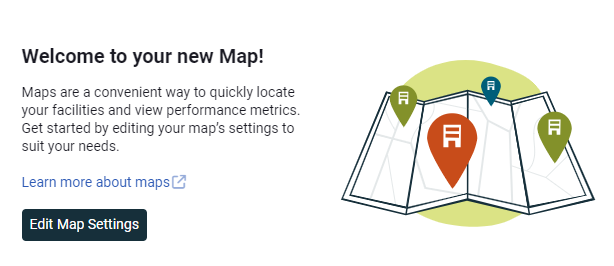
Maps provide a convenient and easy-to-use method for quickly locating your facilities and viewing high-level performance metrics.
How do maps work?
Maps plot your sites and buildings based on latitude and longitude or the site's address and zip code.
- If available, latitude and longitude are used because they are more accurate and load faster.
- If not available, the address is used for mapping.
EnergyCAP automatically assigns latitude and longitude values each month based on the site address—only if those fields are empty. You can manually update or replace these values at any time.
All buildings map
A sample map is available and it has not filter applied. This map shows all your buildings and sites. You can zoom in to a specific building to view utility bill data or zoom out to see the total number of sites in a specific area.
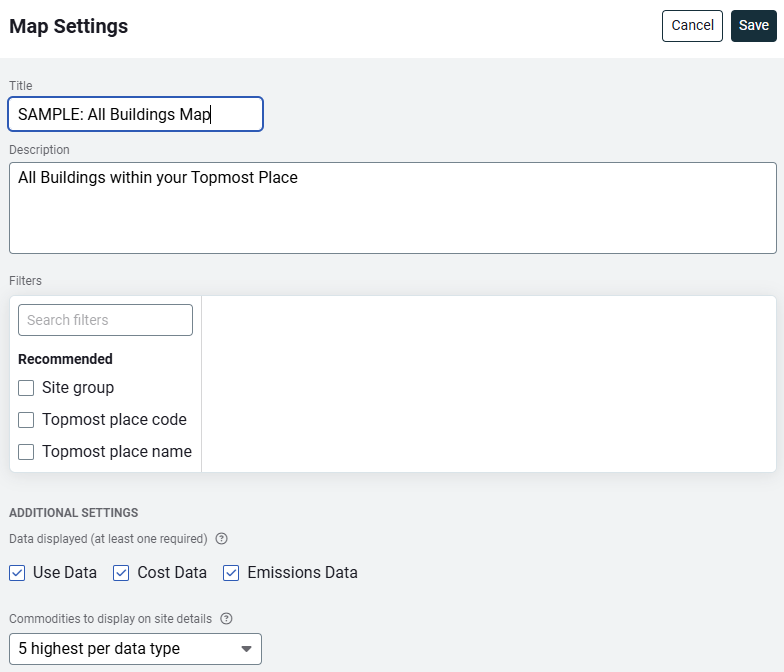
Here are the settings to see all the buildings/sites in your system.
Create and share
Create and share different maps with individual departments and divisions within your organization.
Share maps with the public
In addition to sharing maps with user groups in the application you can also share a map with the public.
Fill out the Map Settings form
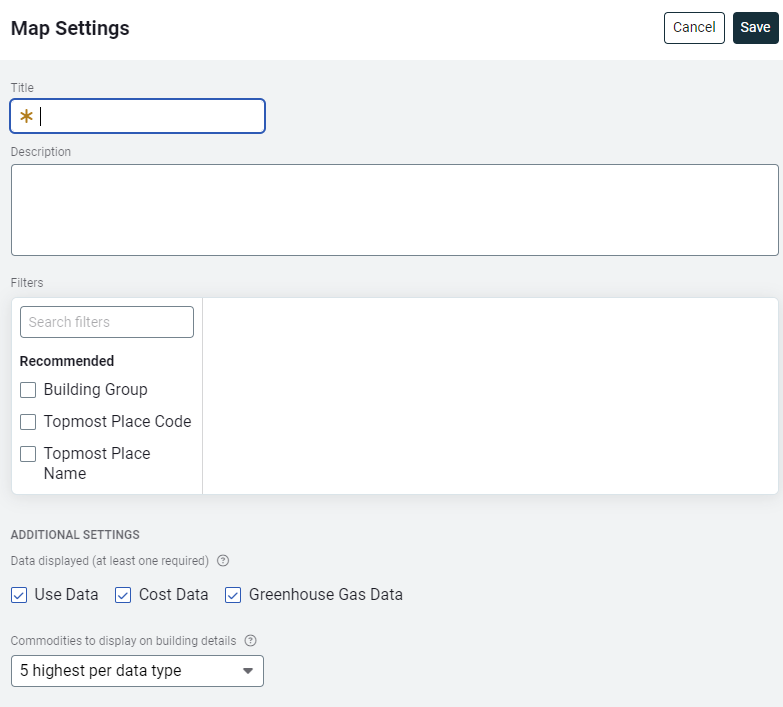
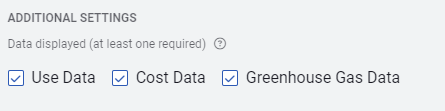
Map Form - Additional Settings
Choose what information you want to be available for viewers.
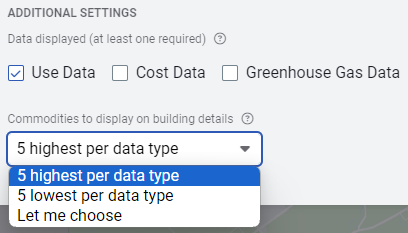
How to view commodity information on a map
You can choose how to display commodity metrics—highest to lowest or lowest to highest—or you can select the specific commodities you prefer to see. *This selection does not impact the site totals.
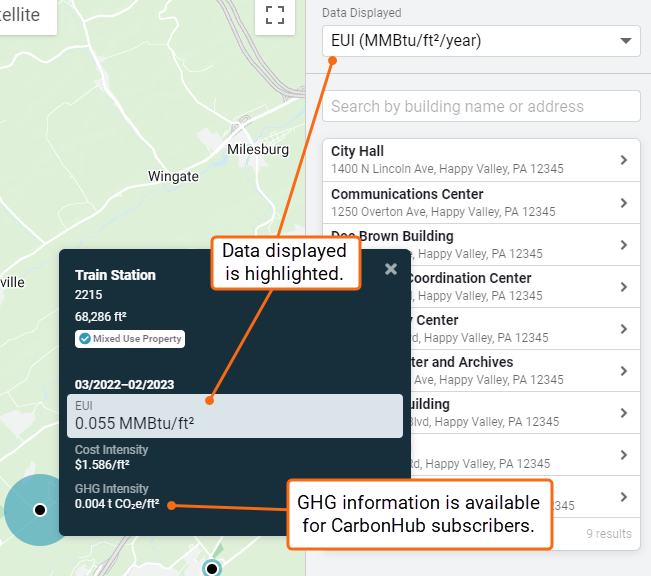
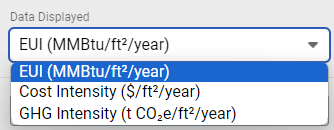
Visual indicator on map
You can benchmark your sites from the map. A visual indicator shows the relative Energy Use Intensity (EUI, MMBtu/floor area/year) or Cost Intensity (cost/floor area/year) based on your display settings.
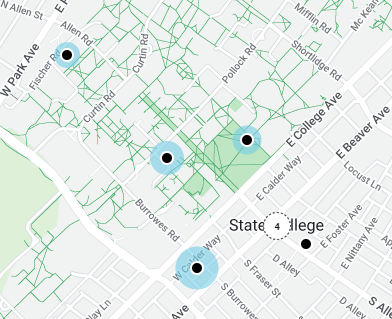
When you hover over the black dot representing a site, the tooltip displays more data.