Groups and benchmarks module
The Groups and Benchmarks module is a powerful tool for identifying sites and meters with unusual cost, use, or demand. These outliers often reveal the best opportunities for reducing costs and improving energy efficiency.
Filters
By default, the module displays billing data for the last 12 months (excluding the current month and the previous month).
You can change the time period using the Filters menu.
Menu selections are persistent from session to session and do NOT reset to default when you log out.

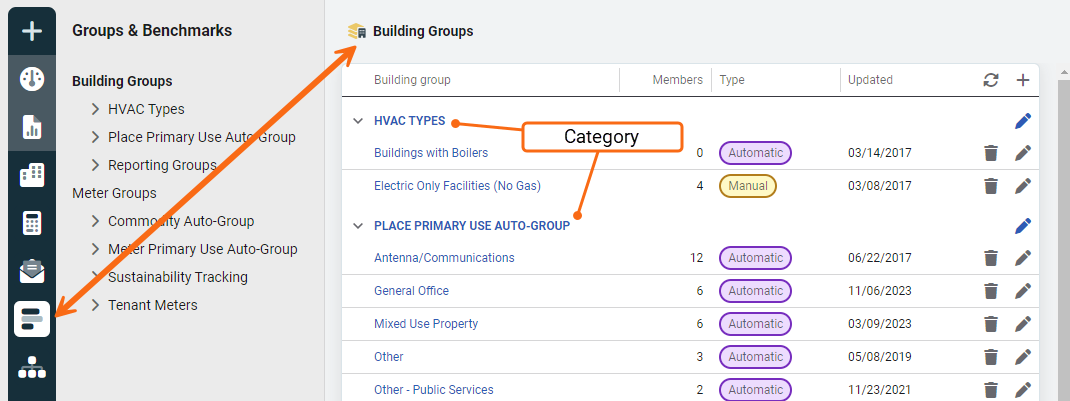
Categories exist under Site Groups and Meter Groups to help you organize your groups.
Categories and groups with no members are not displayed in the tree, empty groups can be managed by clicking on Site Groups or Meter Groups.

Available charts
- High to Low
- Low to High
- Scatter Plot: Visually identify outliers
- Savings Opportunities: Savings opportunity if a group member is reduced to median
- Details: Several columns of data for each group member
Hide a group member
Occasionally you may not be able to improve the performance of a group member and you want to hide it from benchmarks and the calculations.
- Select the hide icon to exclude the member.
- The benchmark calculations and median update automatically.
- To include the member again, on the Sites or Meters tab add the member back in by clicking the Show icon.
Delete a meter or site group
You can delete or edit categories and groups by clicking on Site Groups or Meter Groups in the left panel.
While in the Site Groups or Meters Groups management panel, you can:
- View the number of group members and the group type (manual or automatic).
- Delete a group.
- Edit the group name, category, type, and filters (filters are used when the group is automatic).
- Edit or delete the group category.
Empty categories and groups are hidden
- When a category has no groups, it isn't listed in the left-hand view.
- When a group has no members, or you don't have permission to view its members, it is also hidden from the left-hand side.
- All empty categories and groups are still visible in the management section.
Data rules for groups
- Voided and accrual bills are excluded from all graphs or charts.
- Account charges are included in site benchmarks, but not in meter benchmark data.
*12-month charts
These charts show data for the most recent 12 months, excluding the current month and the previous month.