How to pick a normalization year
Last updated January 23, 2026
The goal in selecting a normalization year is to use a normal weather year and avoid selecting a year with abnormally mild or extremely harsh weather. Review three key areas before selecting a normalization year.
Select a year
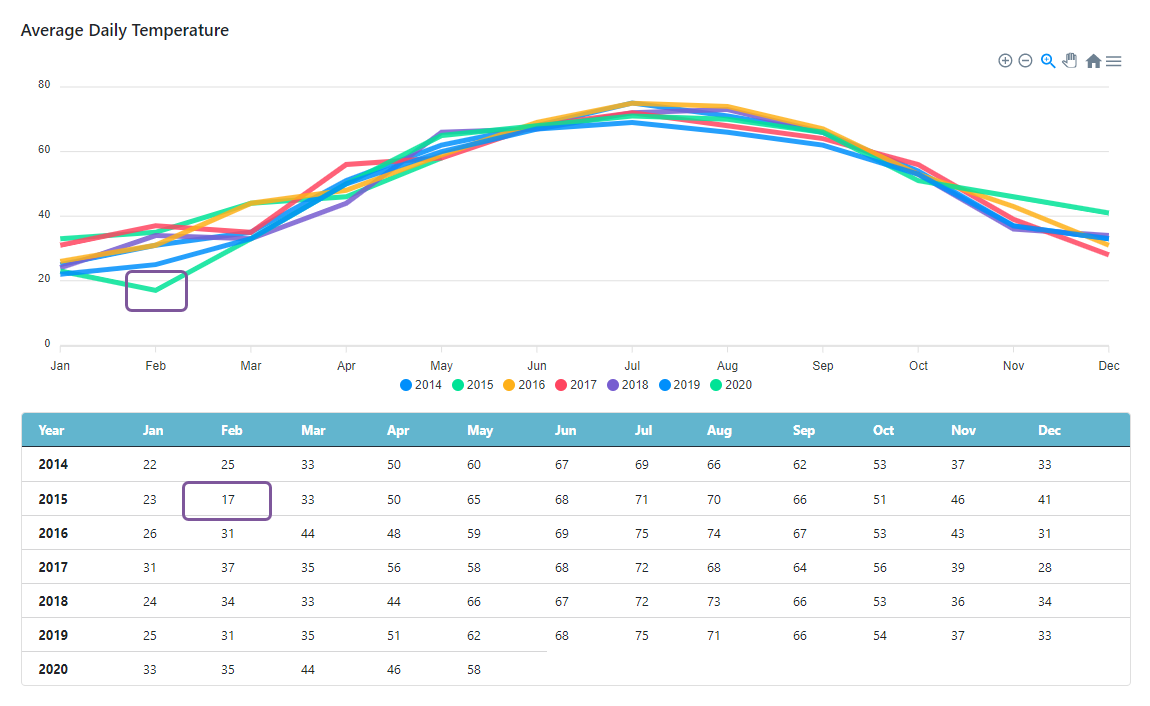
Use Weather Data Depot to review the average daily temperature for your location for the last five years. Make a note of any years with an extreme month.
Cooling degree days
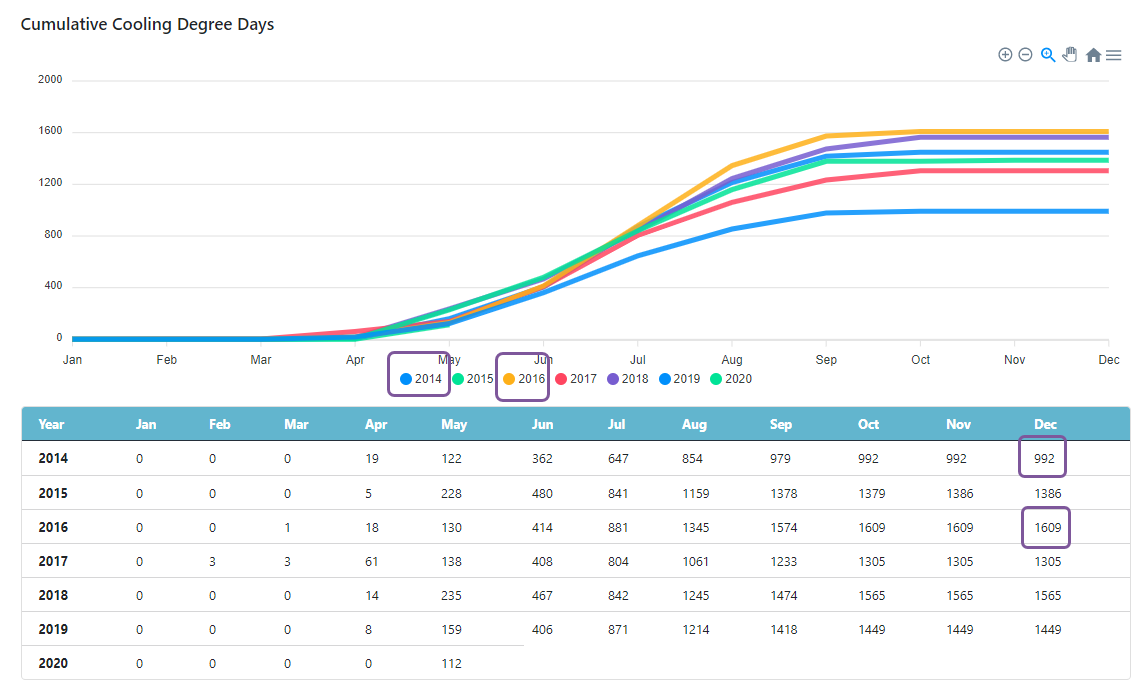
Review the cooling degree days for each year. Review the graph and the number of cumulative degree days for each year. Try to exclude nontypical years.
Heating degree days
Review the heating degree days for each year. Review the graph and the number of cumulative degree days for each year. Try to exclude nontypical years.
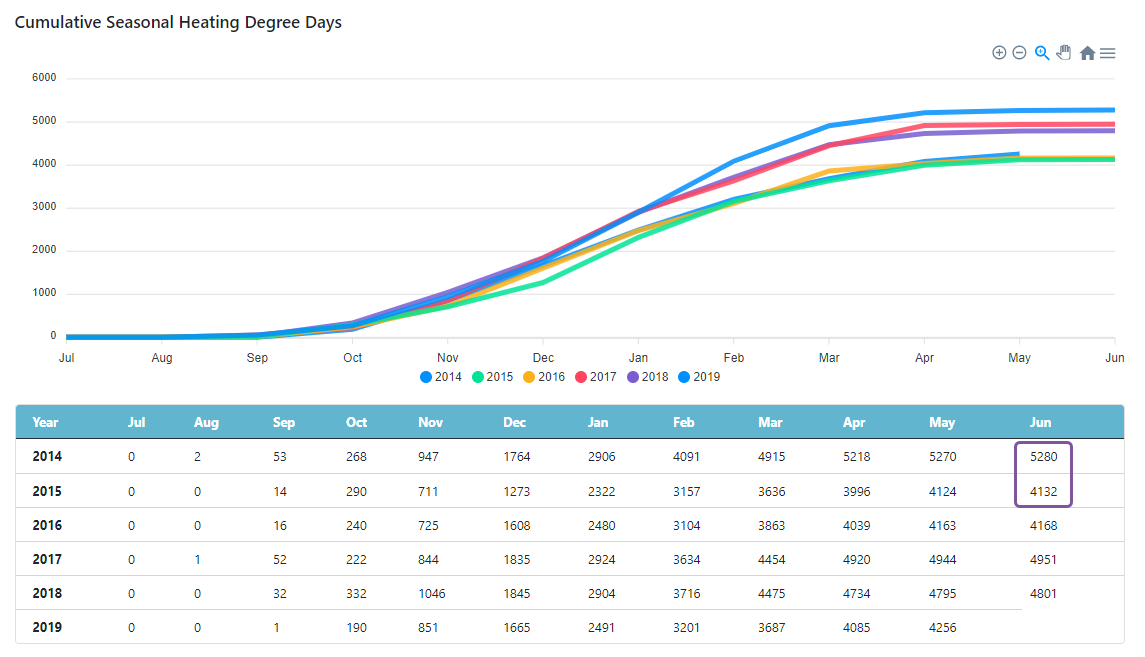
After reviewing the information above, 2017 or 2018 would be an appropriate selection for the normalization year.
Normalization year does not need to align with billing data
The year selected does not have to align with billing data. For example, just because you started tracking utility bills in 2016 does not mean the normalization year must be 2016 or later. If 2010 or 2012 is the most typical year in recent history and if that year has complete weather data for all your stations, use it.