Create a dashboard and add widgets
Last updated April 30, 2026
Here are the steps to create a dashboard that helps you view details on sites in your organization.
The first step is to create the dashboard and then we'll add three widgets.
Steps to create a dashboard
- Go to the Dashboards module.
- Click My Dashboards.
- Click the button Add Dashboard.
- For the title enter "Sites Dashboard".
- In the description add "Practice dashboard".
- Click Save.
You should now see Welcome to your new dashboard!
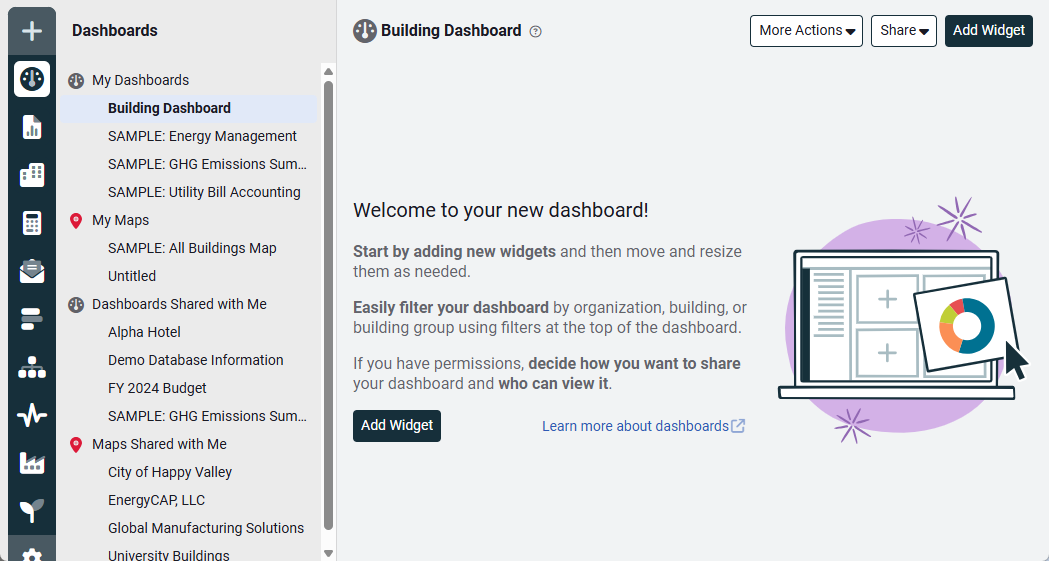
Examples of how to add widgets to your dashboard
Add the widget Bar Rank
- Click Add Widget.
- There are many widgets available to add to a dashboard. For this example let's narrow our search to widgets that show site information. For the Object quick filter at the top, select Sites.
Set the filters
- Add the Bar Rank widget.
- Enter a title - "Top 10 Sites for Electric Use".
- Enter a description - "Lists the top 10 sites for calendarized electric use for the prior 12 months, excluding the current month".
- Chart color = blue.
- Data type = calendarized.
- For Date range, select prior year.
- Group by = sites.
- Number of results to display = 10.
- Sort descending = yes.
- Value = use.
- Account is active = yes.
- Bill is void = Not Void.
- Include accrual bills = no.
- Add the commodity filter by selecting it from the left panel.
- Commodity = Electric.
- Click Save.
Here's a screenshot of what your filters should look like.

Widget size
You can adjust the size of the widget by dragging a corner. It may be helpful to make this widget taller to see all 10 sites.
Your dashboard now has one widget and should look something like this.

Add the widget Most Expensive Sites
- Click Add Widget.
- For the Object quick filter at the top, select Sites
Set the filters
- Add the Most Expensive Sites widget.
- Enter a title - "Most Expensive Sites".
- Enter a description - "Top 10 most expensive sites ".
- Click Save.
- Adjust the size of the widget to see all the sites in the widget.
Your dashboard now has two widgets and might look like this.

To complete the dashboard let's add one final widget.
Add the widget Rolling Monthly Comparison
- Click Add Widget.
- For the Object quick filter at the top, select Sites.
Set the filters
- Add the Rolling Monthly Comparison widget.
- Enter a title - "Electric meters by month".
- Enter a description - "All electric meters by cost".
- Data type = Billing Period Data.
- Number of years = 2.
- Value = cost.
- Add the Commodity filter and set equals to Electric.
- Click Save.
- Adjust the size of the widget.
Your dashboard now has three widgets and might look like this.
