Energy use intensity overview
Last updated July 6, 2026
Energy use intensity (EUI) measures how much energy a building uses relative to its size. It is calculated by dividing total energy use by the building's floor area, giving you a normalized metric that makes it possible to compare energy performance across buildings of different sizes—regardless of how large or small they are.
EUI is useful for tracking long-term energy trends, benchmarking sites against each other, and setting reduction goals. In EnergyCAP, EUI is found on the Normalization tab in the Sites and Meters module and supports up to 10 years of trend data.
When a site's floor area is zero, EUI for that site is reported as zero.
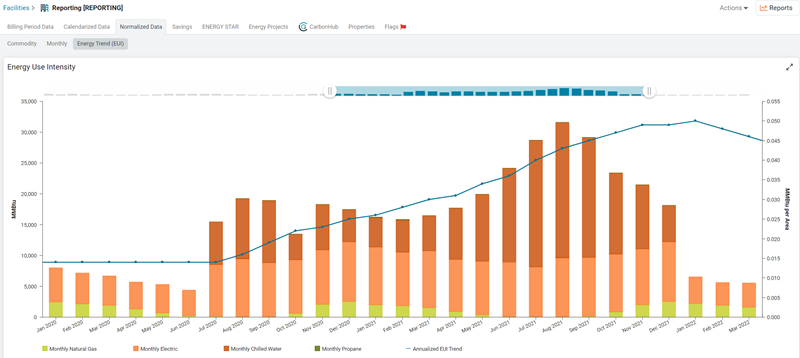
Energy Use Intensity facts
- Plots all energy commodities for the site or organization (excluding water, refuse, etc.).
- Provides a rolling 12-month average trend line.
- This helps minimize effects caused by seasonality.
- Each data point is the sum of global use for the prior 12 months divided by the maximum floor area for the site or organization in the same 12 month period.
- Remove any commodity from the chart by clicking the commodity color in the legend.
- Limits data shown with date sliders, the slider is available after 5 years of data is available.
- Shows a trend line after 18 months of data exist.
Commodity energy use (colored bars) is expressed in global units (KBtu or MMBtu). Typically these settings are configured during the initial setup.
EUI reduction goals
Use the EUI widget to set long-term energy reduction goals for your sites and track progress over time.
- Set an overall EUI reduction goal for a site, based on a selected baseline year's average EUI.
- Example: Using a 2025 baseline, target a 20% overall reduction in EUI by 2050.
- Add periodic milestones as stepping stones toward the overall goal.
- Example: A 5% reduction by 2030, followed by another 5% reduction by 2035.
- Track progress over time by comparing yearly EUI values—recorded from the date the goal was created—against each milestone and the overall goal.
- Edit future milestones at any time to adjust your reduction plan as conditions change.
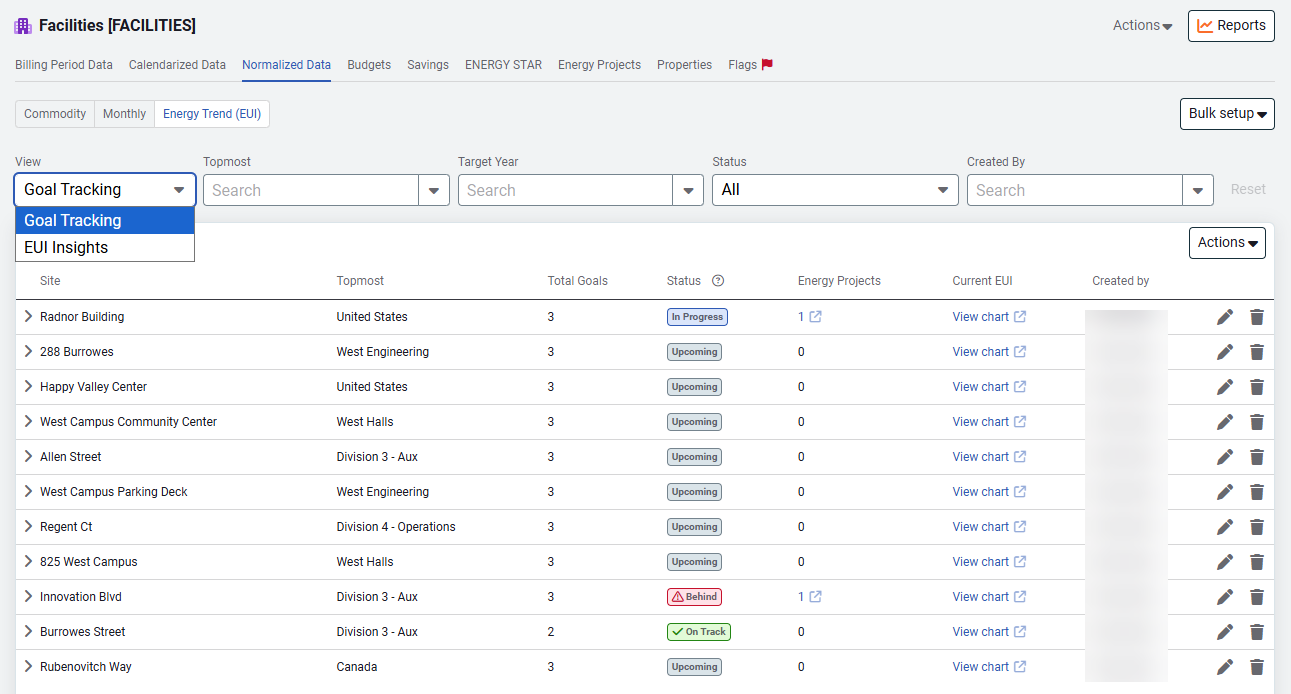
Organization-wide EUI goal progress
View EUI goal progress at the organizational level on the Normalized data tab. Easily change your view between Goal Tracking and EUI Insights.
- You can export a csv of your goals or print the goals.
- Use a spreadsheet to create or update your goals in bulk.
- You can find the create and update sheets on the Setup Spreadsheets Log or on the Goal Tracking view screen.