May 27, 2026
Published May 28, 2026
Bulk actions for problem files
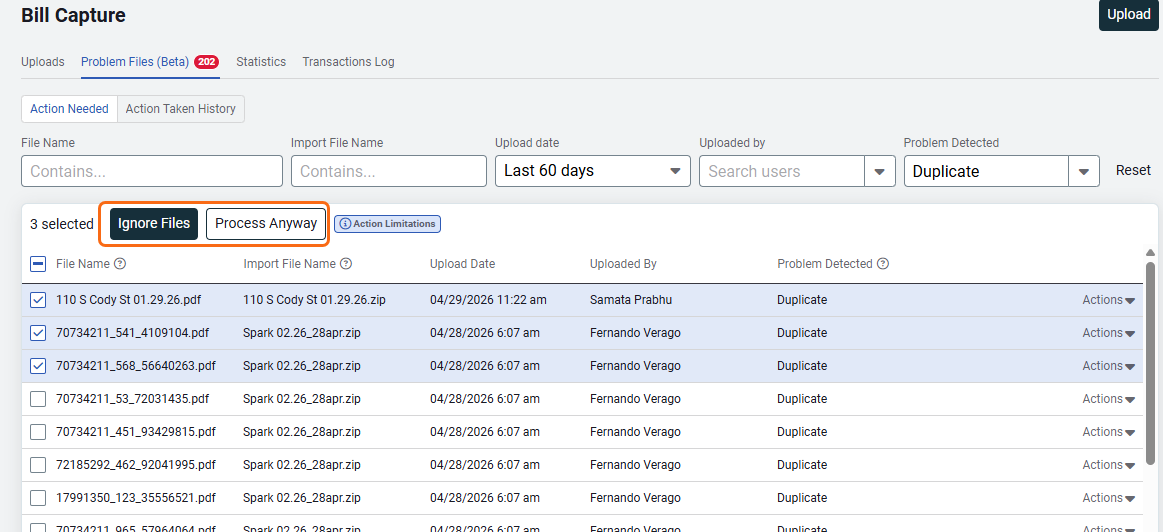
In Bill Capture, the Problem Files tab now supports bulk actions. Select multiple files on the current page and apply the same action to all of them at once.
On an unfiltered list that contains a mix of problem types, your only bulk option is Ignore Files. When you filter the list to show only duplicates, you also have the option to Process Anyway.
Bulk actions work on one page of results at a time.
Energy Projects dialog refresh
We've added a new Expected Impact field so you can record whether a project is expected to have a positive, negative, or unknown effect on energy use.
Interval data
See reading notes directly on charts
Reading notes used to live only inside the source and summarized reading tabs, which made them hard to find when you were trying to understand anomalies on a chart. We've surfaced them directly on interval data charts so you can see what was happening at each data point in context—turn notes on to see why a spike or unusual dip occurred.
Notes from both source and summarized readings show up in a single, unified view. They're hidden by default—use the toggle to show or hide them. When you select a longer time range, notes are aggregated to keep the chart readable.
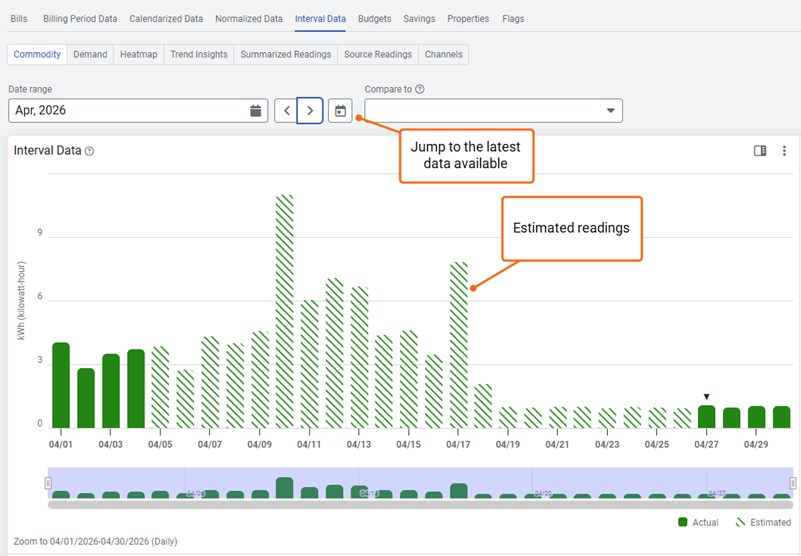
Jump to the most recent interval data
We've added a third button alongside the existing next and previous steppers in Powerviews on the Commodity and Demand sub tabs that takes you directly to the period containing the most recent interval data—no more stepping back through months to find it.
Click the button to jump to the period with the latest available data. The view follows your current period type: monthly view goes to the most recent month, daily view goes to the most recent day, and so on. For a selected range, the window shifts to end at the latest date while preserving the range length.
Distinguish estimated and actual readings on charts
Until now, all summarized readings on interval data charts looked the same regardless of where the data came from. We've added a new toggle that distinguishes estimated readings from actual readings, so you can quickly see the origin of the data you're analyzing.
The toggle is available at the meter level on all chart types (line and bar) for time periods up to one quarter. It's off by default—turn it on when you want to see the distinction. Pair it with reading notes to understand why a reading was estimated, for example a new meter installation or a temporary meter failure where the utility provided estimated values.
Drill into charts by clicking a bar or line
Investigating a spike or an unusual pattern used to mean stepping back to the date picker to change the range manually. We've added click-to-drill-down on summarized charts so you can move from a year view into a quarter, month, or date range with a single click on the data itself.
Hover a bar or line to see the date that will open on click. Click to open that period and the date picker updates automatically. Works across year, quarter, month, and date range views.
