Report-02
Last updated May 14, 2026
Ranking Report
Report-02 is a ranking report that displays a data table of objects—such as sites, meters, accounts, or cost centers—sorted by a metric you choose. Results are listed in descending order (highest to lowest), making it easy to spot top performers and outliers across your portfolio. Common metrics include:
- Use
- Cost
- Unit cost
- Cost or use per area
- Cost or use per day
Demand is not available as a Rank by option in Report-02. To view demand values across multiple sites or meters, use Report-08 and set Value = Demand.
Group by
Use the Group by filter to define what is ranked (what appears on each row).
Common options include meter or site.
Example uses
- Rank sites by cost per area (or per day) for one or more commodities within a selected date range.
- Rank sites by use per area (or per day) for one or more commodities within a selected date range.
- Rank accounts, cost centers, meters, or organizations by use or cost per day for one or more commodities within a selected date range.
Report-02 is available as: PDF, Excel, Word

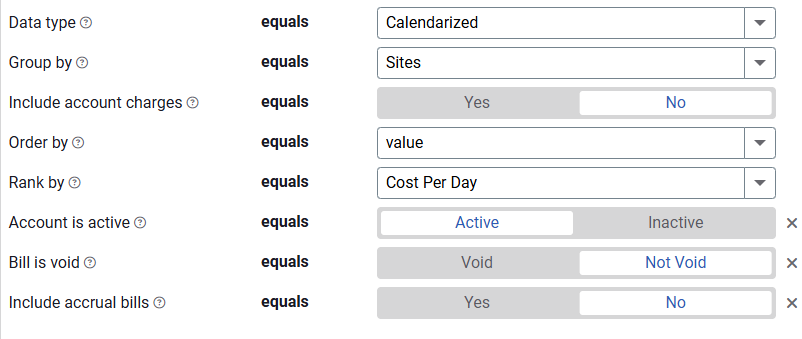
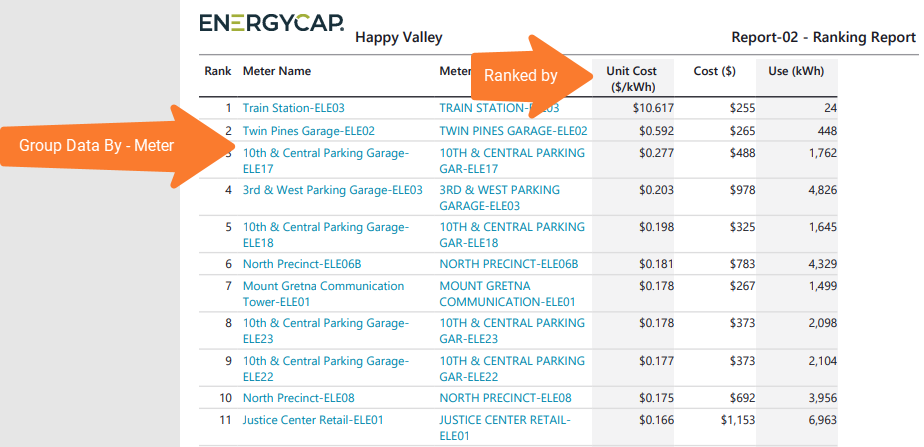
Filters used to create the sample Report-02 shown above.
Report-02 recommendations
When you are reporting on Cost Avoidance, remember to run Cost Avoidance -> Calculate Savings first.

Report-02 tip
For the ranking to be useful, be sure the objects are comparable (ranking all electric meters or all libraries). It might be helpful to create your own building or meter group and use the new group as a filter.
Set your filters for Report-02
- In the Data type field, choose the data set you want to use for the report.
Data set When to use it Why it helps Billing Period Accounting, chargebacks, or any task that needs the exact bill dates Uses the raw start and end dates from the utility bill Calendarized Month-to-month or year-over-year analysis of cost and usage Spreads each bill across true calendar months so totals line up with financial periods. Displays both use and cost. Normalized Year-over-year usage analysis Adjusts energy use for weather, removing temperature as a variable - Group by
Choose what each row in your report represents. TIP: A common choice is site. - Include account charges
Check this option if you want to include account level charges (like one-time fees or recurring service charges) in the report.
These charges are not tied to use or demand, so they show up separately from use-based costs. - Order by
Choose how to sort the report rows:
Name or code – sorts alphabetically.
Value – sorts by the value selected in Rank by (highest to lowest). -
Rank by
Select the metric to rank your data by. -
Date range or Accounting period
Set the time frame for your report, if not used, all billing periods are included.
- Use Date range to select a calendar-based window.
- Use Accounting period if you want to align with your organization's financial periods. Note: You must use billing period data with this option.
Other filters to consider for Report-02
- Commodity category
Groups commodities into broader categories such as Electric or Gas. Use this filter when you want to roll up all commodities within a category rather than selecting individual ones. Not compatible with the Commodity filter. - Active accounts only
Decide whether to include only active accounts.
If this filter is not applied, your report includes both active and inactive accounts. - Void bills
Include if you want a full audit history.
Exclude to focus only on valid financial activity.
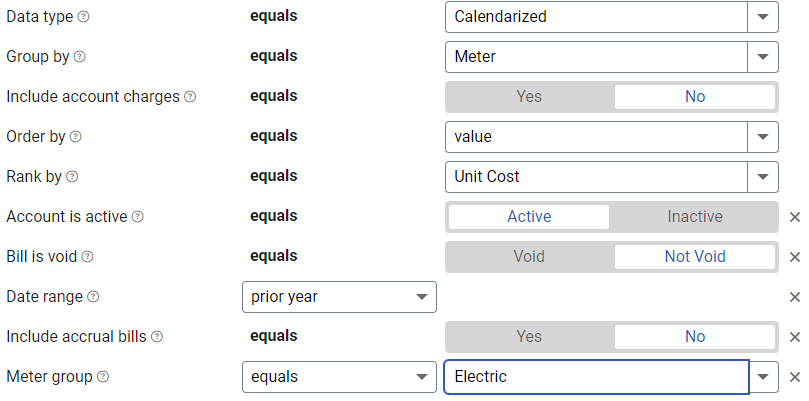
Example filters for Report-02
Identify extreme average unit cost for a meter.
Available filters for Report-02
Required filters for Report-02
- Data type - You can select calendarized, billing period, or normalized.
- Group by - For Report-02 the Group by filter determines what is on each row in your report (commodity, buildings, meter). TIP: A common choice is Sites; this creates a report that ranks the selected sites (by what you select for Rank by). You can Group by: account, commodity, cost center, meter, organization types, site types, sites, vendor.
- Include account charges - Account charges are separate from meter charges and not used in calculating unit cost. (For example, late fees, connection charges, or deposits)
- Order by - For Report-02 this filter sets how you want the rows ordered.
Select name or code if you want to order your report alphabetically. Select value if you want the report ordered (highest to lowest) by the use or cost you selected for the Rank by filter.
- Rank by - For Report-02 this sets the type of use or cost you want to report on.
Rank by values include: annualized cost per area, annualized use per area, BATCC cost, BATCC use, Cost Avoidance, Cost Avoidance %,cost per area, cost per day, unit cost, use avoidance, use avoidance %, use per area, use per day.
Recommended filters for Report-02
- Accounting period - When you use the filter Accounting period you must set Data type to billing period data.
- Date range - For the date range filter in Report-02, if you don't select an Accounting period or Date range, all billing periods are included.
The date range operator can be: less than, between, greater than, less than or equal to, greater than or equal to, prior year, prior fiscal year, prior 12 months (includes current month), prior 12 months (excludes current month), year-to-date (including current month), year-to-date (excluding current month), fiscal year-to-date (including current month), fiscal year-to-date (excluding current month) - Meter group - Lets you filter the report to a specific group of meters.
- Site group - Lets you filter the report to a specific group of sites.
- Topmost cost center code - When you use this filter you are selecting the topmost cost center you want to be included. When you set a topmost cost center it is the highest level of the accounting tree used, this lets you select a subset of data for reporting.
- Topmost cost center name - When you use this filter you are selecting the topmost cost center you want to be included. When you set a topmost cost center it is the highest level of the accounting tree used, this lets you select a subset of data for reporting.
- Topmost place code - Select the topmost organization or site you want to be included. When you set a topmost organization or site it is the highest level of the facilities tree used, this lets you select a subset of data from your tree for reporting.
- Topmost place name - Select the topmost organization or site you want to be included. When you set a topmost organization or site it is the highest level of the facilities tree used, this lets you select a subset of data from your tree for reporting.
Optional filters for Report-02
- Account is active - If this filter is not included, both active and inactive accounts are included in the report.
- Account name - Filter to one or more accounts. Use caution when combining with topmost or group filters.
- Account number - Filter for one or more accounts. Use caution when combining with topmost or group filters.
- Accounts in cost center code - Filter to include accounts directly under one or more cost centers. To see all the accounts at a certain level in your hierarchy use the topmost cost center filter. Use caution when combining with other topmost or group filters.
- Accounts in cost center name - Filter to include accounts directly under one or more cost centers. To see all the accounts at a certain level in your hierarchy use the topmost cost center filter. Use caution when combining with other topmost or group filters.
- Bill is from external vendor - When this filter is not selected, the report includes data from both vendor (external) and chargeback (internal) bills.
- Bill is void - If this filter is not included both void and not void bills are included.
- Commodity - Select one or more commodities. This filter is not compatible with the commodity category filter.
- Commodity category - This filter is not compatible with the commodity filter.
- Include accrual bills - If this filter is not included, the report includes accrual bills.
- Meter code - Filter to one or more meters. This filter is not compatible with topmost filters.
- Meter name - Filter to one or more meters. This filter is not compatible with topmost filters.
- Meters in site code - Filter to include meters directly under one or more sites. To see all the meters at a certain level in your hierarchy use the topmost place filter. Use caution when combining with other topmost or group filters.
- Meters in site name - Filter to include meters directly under one or more sites. To see all the meters at a certain level in your hierarchy use the topmost place filter. Use caution when combining with other topmost or group filters.
- Vendor code - Filter by one or more vendors. To see all vendors, do not include a topmost or group filter. You can combine with other filters if you want to refine your results.
- Vendor name - Filter by one or more vendors. To see all vendors, do not include a topmost or group filter. You can combine with other filters if you want to refine your results.