Report-08
Last updated May 13, 2026
Monthly Trends—One Page per Year
Report-08 displays a line chart and data table of monthly values for multiple objects over a single year. Use this report to identify trends, patterns, and changes in use, cost, or other key metrics.
What the report shows
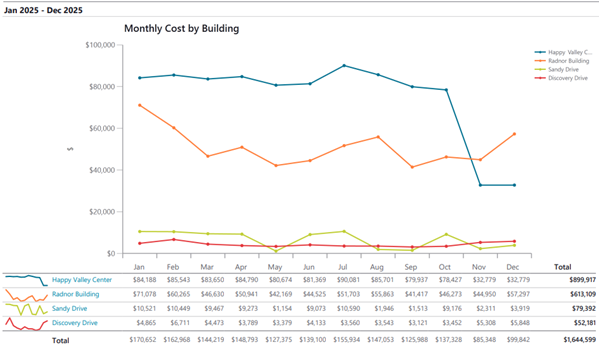
- A line chart comparing similar objects (such as meters, cost centers, or sites) over a one-year period
- A data table with the monthly values that support the chart
Why it’s useful
This report helps you:
- Compare the performance of similar objects
- Identify outliers or unusual patterns
- See how objects perform relative to each other throughout the year
Example use
-
Report on the monthly cost for each site in a selected region for the previous year.
Available formats
Report-08 is available as: PDF, Excel, Word
Report-01 vs Report-08
These reports may look similar, but they focus on different comparisons:
- Report-01 compares multiple years for one object
Example: A site's total commodity cost for 2015 to 2020. - Report-08 compares multiple objects for one year
Example: Several sites' monthly commodity cost for 2020
Report-08 recommendations
- When you are reporting on Cost Avoidance, remember to run Cost Avoidance -> Calculate Savings first.

- If you use chargebacks, remember to use the appropriate Topmost place or Topmost cost center to avoid double counting use or cost.
Report-08 tip
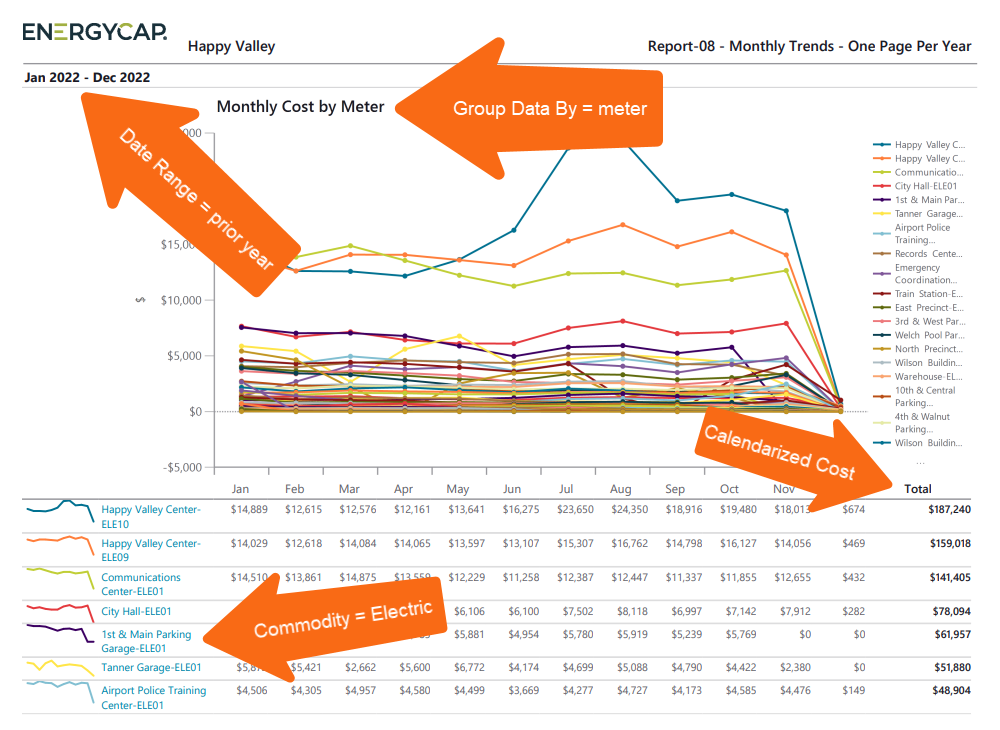
Use the filter Group by to set what each chart line represents. It may be necessary to set a filter for a topmost or group to limit the number of lines in the chart.
Set your filters for Report-08
- Choose the type of data you want in your report with the Data type.
Data set When to use it Why it helps Billing Period Accounting, chargebacks, or any task that needs the exact bill dates Uses the raw start and end dates from the utility bill Calendarized Month-to-month or year-over-year analysis of cost and usage Spreads each bill across true calendar months so totals line up with financial periods. Displays both use and cost. Normalized Year-over-year usage analysis Adjusts energy use for weather, removing temperature as a variable - First month
Set the month you want the report to start with. - Group by
Decide what each chart line represents. It may be helpful to set a topmost or group to limit the number of lines on the chart. - Include account charges
Decide whether to include one-time or periodic charges.
These are not linked to use or demand on the bill. - Value
Select the value you want to report on. - Date range
Try using prior year or prior 12 months so you don't have to reset this filter when using subscriptions or distributions.
For Report-08 when you select more than one year, the objects for each year are sorted by the monthly average usage across all the years. This keeps the order of all the objects the same for each year of the report and therefore easier to find and compare details from year to year.
Other filters to consider for Report-08
- Commodity category
Groups commodities into broader categories such as Electric or Gas. Use this filter when you want to roll up all commodities within a category rather than selecting individual ones. Not compatible with the Commodity filter. - Active accounts only
Decide whether to include only active accounts.
If this filter is not applied, your report includes both active and inactive accounts. - Void bills
Include if you want a full audit history.
Exclude to focus only on valid financial activity. - Topmost place
When set to a specific organization, and paired with Group by site, the report shows one chart or table per site under that organization.
Available filters for Report-08
Required filters for Report-08
- Data type - You can select calendarized, billing period, or normalized.
- First month - Select the starting month (1 thru 12), this is a calendar month not a fiscal month.
- Group by - Determines what each chart line represents (commodity, buildings, meter). TIP: It may be helpful to set a topmost or group to limit the number of lines on the chart
- Include account charges - Account charges are separate from meter charges and not used in calculating unit cost. (For example, late fees, connection charges, or deposits)
- Value - Select the value you want to report on. Values include: Cost, Cost Avoidance, Cost Avoidance %, Cost per area, Cost per day, Demand, Total emissions, Unit cost, Use, Use Avoidance, Use Avoidance %, Use per area, use per day.
Recommended filters for Report-08
- Accounting period - You must select either Accounting period or Date range. When you use Accounting period you must set Data type to billing period data. Not compatible with the Date range filter.
- Date range - for Report-08 setting the date range can be helpful when using report distribution. Set the filter for the prior year or year-to-date to have the date automatically update each time the report is created.
- Meter group - Lets you filter the report to a specific group of meters.
- Site group - Lets you filter the report to a specific group of sites.
- Topmost cost center code - When you use this filter you are selecting the topmost cost center you want to be included. When you set a topmost cost center it is the highest level of the accounting tree used, this lets you select a subset of data for reporting.
- Topmost cost center name - When you use this filter you are selecting the topmost cost center you want to be included. When you set a topmost cost center it is the highest level of the accounting tree used, this lets you select a subset of data for reporting.
- Topmost place code - Select the topmost organization or site you want to be included. When you set a topmost organization or site it is the highest level of the facilities tree used, this lets you select a subset of data from your tree for reporting.
- Topmost place name - Select the topmost organization or site you want to be included. When you set a topmost organization or site it is the highest level of the facilities tree used, this lets you select a subset of data from your tree for reporting.
Optional Filters
- Account is active - If this filter is not included, both active and inactive accounts are included in the report.
- Account name - Filter for one or more accounts. This filter is not compatible with topmost or group filters.
- Account number - Filter for one or more accounts. This filter is not compatible with topmost or group filters.
- Accounts in cost center code - Filter to include accounts directly under one or more cost centers. To see all the accounts at a certain level in your hierarchy use the Topmost cost center filter. This filter is not compatible with other topmost or group filters.
- Accounts in cost center name - Filter to include accounts directly under one or more cost centers. To see all the accounts at a certain level in your hierarchy use the Topmost cost center filter. This filter is not compatible with other topmost or group filters.
- Bill is from external vendor - When this filter is not selected, the report includes data from both vendor (external) and chargeback (internal) bills.
- Bill is void - If this filter is not included both void and not void are included.
- Commodity - Select one or more commodities. This filter is not compatible with the commodity category filter.
- Commodity category - Groups commodities into broader categories such as Electric or Gas. Use when you want to roll up all commodities within a category rather than selecting individual ones. Not compatible with the Commodity filter.
- Include accrual bills - If this filter is not included, the report includes accrual bills.
- Meter code - Filter to one or more meters. This filter is not compatible with topmost filters.
- Meter name - Filter to include one or more meters. This filter is not compatible with topmost or group filters.
- Meters in site code - Filter to include meters directly under one or more sites. To see all the meters at a certain level in your hierarchy use the Topmost place filter. This filter is not compatible with other topmost or group filters.
- Meters in site name - Filter to include meters directly under one or more sites. To see all the meters at a certain level in your hierarchy use the Topmost place filter. This filter is not compatible with other topmost or group filters.
- Vendor code - Filter by one or more vendors, to see all vendors do not include a topmost or group filter. You can combine with other filters if you want to refine your results.
- Vendor name - Filter by one or more vendors, to see all vendors do not include a topmost or group filter. You can combine with other filters if you want to refine your results.
Configured Report-08 options
Report-08 is flexible and has many options available to configure. To help you be successful two configured reports are available to help get you started.
Each report has its own preset filters and instructions.
