Interval data tabs
The available tabs depend on whether you are viewing a meter or a site. Each tab provides charts and tables to help analyze interval data.
Interval Data Powerview features
Interval Data Powerviews display interval data for a chosen date range. They offer several interactive tools to help you analyze, compare, and extract insights.
Core features (available in all Powerviews)
- Date range selector
Choose the time span for the interval data you want to view. - Side panel options (not available with demand)
Customize your data view using filter and display settings. - Chart type options
View data as:
- Line chart
- Bar chart
- Stacked chart - Group by options
Organize data by:
- Children, available at the site level (submeters or sub-locations)
- Commodity (for example, electricity, gas)
- Commodity category - Schedule overlay
Compare interval data against a schedule. The schedule is visible when the chart contains seven days or less of data. When it is applied for longer periods schedule data is available in the table. - Data table view
View the Powerview data in a detailed tabular format. - Copy table data
Copy data from the table for use outside of EnergyCAP.
Interval Data meter secondary tabs
There are six tabs for viewing and analyzing interval data at the meter level. The primary value channel is shown in commodity and energy Powerviews. The primary demand channel is shown in the demand Powerview.
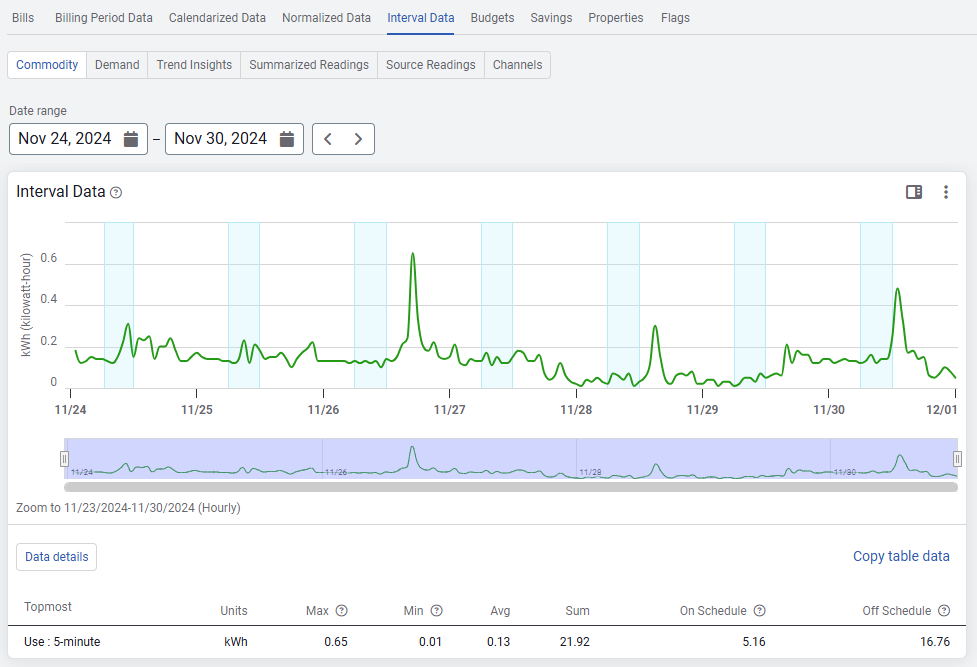
1. Commodity Powerview
- By default, the commodity Powerview for a meter shows the primary value channel data for the current month.
- You can compare energy use to a schedule to see how use changes at different times of the day.
- The schedule overlay is available for up to 7 days.
2. Demand Powerview
- By default, the demand Powerview for a meter shows the primary demand channel data for the current month
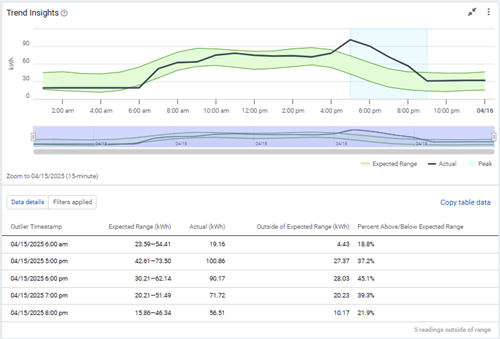
3. Trend Insights Powerview
- Trend Insights shows actual data from your primary value channel or demand channel alongside a forecasted range based on historical data. The forecast updates over time as the system collects more readings.
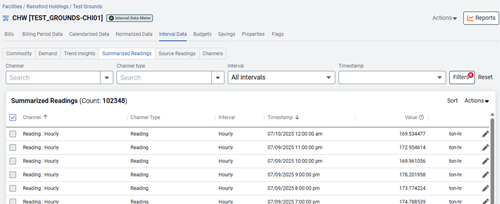
4. Summarized Readings secondary tab
Summarized readings
The summarization method is applied to the computed readings in each time interval. The smallest time interval is 5 minutes.
Summarized readings are snapped to the clock. For example, readings are grouped as defined on the channel (5 minute, 15 minute, etc.) and are assigned to the time interval that was defined. For example, a 15-minute channel has readings at 8:15, 8:30, 8:45.
5. Source Readings secondary tab
Readings are displayed for the selected meter.
- Source readings
These are unprocessed by EnergyCAP. - Computed readings
Reading have rules and units applied. These readings are not snapped to the clock. The smallest time interval is one minute.
Quick filters
Filter summarized data by:
- Channel
- Channel type
- Interval
- Timestamp
Data tags
- Estimated readings are marked with an "e".
- Calculated channels are marked with a sigma symbol
6. Channels secondary tab
The Channels secondary tab contains a table of all channels linked to the selected meter.
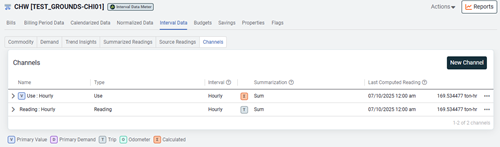
Add a channel
Click the New Channel button to create and assign a new channel to the meter.
Channel actions
Use the three-dot menu next to a channel to:
- Edit the channel settings.
- Create a new version of the channel.
Channel type tags
- V – Primary value
- D – Primary demand
- T – Trip
- O – Odometer
- Σ – Calculated
Interval data at the site level
1. Commodity Powerview
- Interval data grouped by commodity (for example, electric or gas) or commodity category (for example, energy or water)
- You can select a time range from 1 day to 1 year.
2. Energy Powerview
- A Powerview showing energy use based on the primary value channels.
- Choose any energy commodity or commodity category.
- Helps visualize energy use patterns at the site level.
3. Demand Powerview
- Powerview that focuses on demand.
- Select commodity or commodity category.
- View demand of your utilities over time.
4. Channels secondary tab
- A table listing all the channels from the meters at the site.
- Gives you a detailed view of how data is collected for each meter.