Report-01
Last updated May 13, 2026
Monthly Trends—Comparing Year to Year
Report-01 displays a line chart and data table that show monthly values across multiple years. Use this report to identify trends, patterns, and changes in use, cost, or other key metrics. You can compare the same month across different years to see how performance changes over time.
You can also apply variance filters to highlight exceptions or unusual changes automatically.
A data table below the chart lists the detailed monthly values that support the visual data.
What the report shows
- Monthly values across multiple years
- A line chart for visual comparison
- A data table with detailed monthly values
Why it is useful
This report helps you quickly identify:
- Seasonal trends
- Year-over-year increases or decreases
- Anomalies or outliers in specific months
For example, you might notice that electricity use in July 2024 is much higher than in July 2023, prompting further investigation.
Report versions
- One page executive summary—Displays all data on a single page. (No Group by filter.)
- One page per object—Displays a separate page for each selected object. (Group by filter applied.)
Example uses with the Group by filter
- Compare electric cost or use by month for each site for the last five years.
- Compare total cost or use for all commodities by site for the last five years.
Example uses without the Group by filter
- Create a one-page report that compares electric cost or use by month for the entire organization for the last five years.
- Report on any commodity by month for an organization, site, meter, or account for the last five years.
Filters
Use the Value filter to report on:
- Cost
- Use
- Demand
- Other key metrics
You can also limit the report to a single commodity if needed. The time frame is flexible, allowing you to analyze different reporting periods.
Available formats
Report-01 is available as: PDF, Excel, Excel (data only), Word
Report-01 is one of the most versatile reports available.
Example 1—Year-over-year report for sites
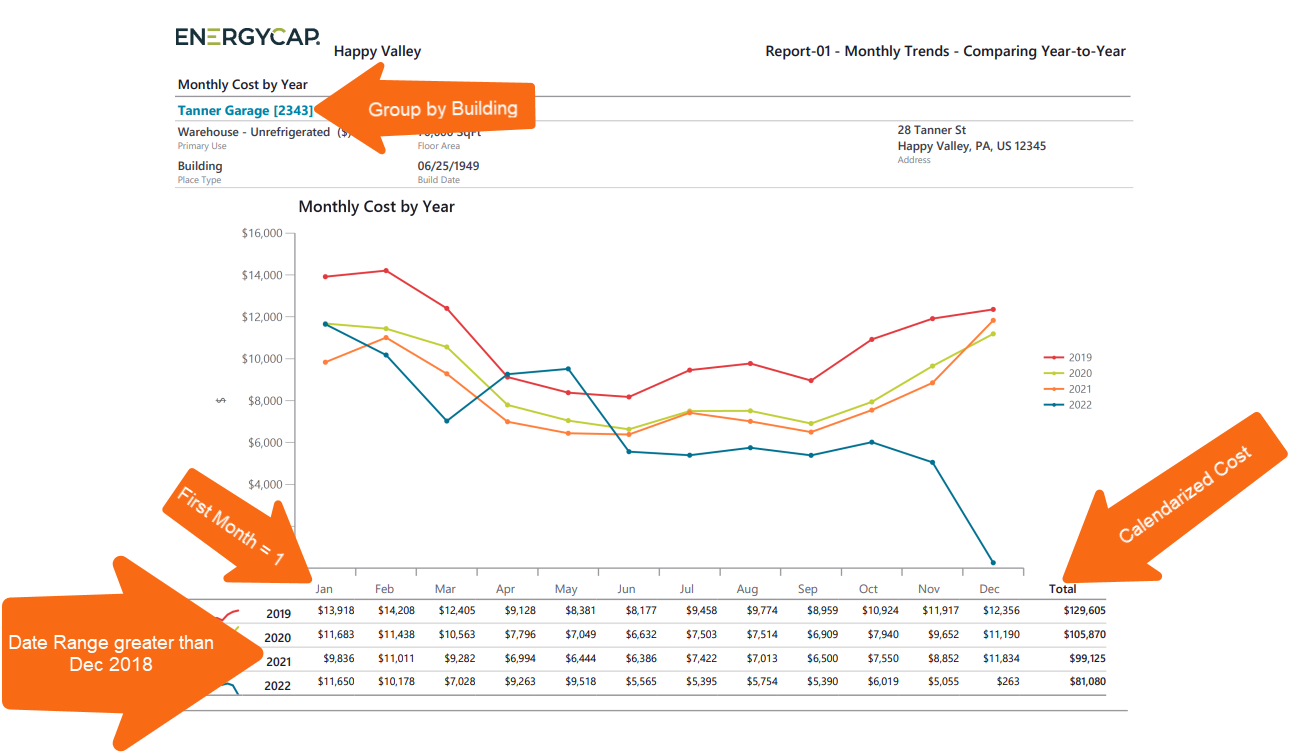
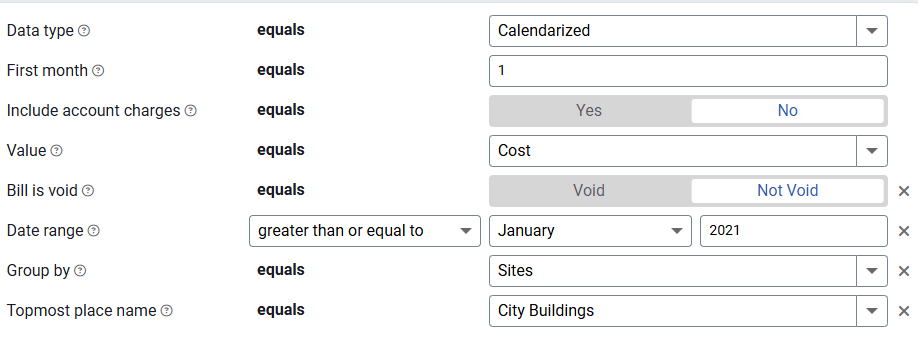
Example Report-01 shows calendarized cost data by site for all years after 2021. Each year appears as a separate colored line on the chart. Because Group by = Sites is applied, the report generates one page per site.
Example 1 filter settings
- Data type = calendarized
- First month = 1
- Include account charges = no
- Value = cost
- Bill is void = Not Void
- Date range >= January 2021
- Group by = Sites
- Topmost place name = City Buildings
Example 2—Year-over-year cost report for the entire organization
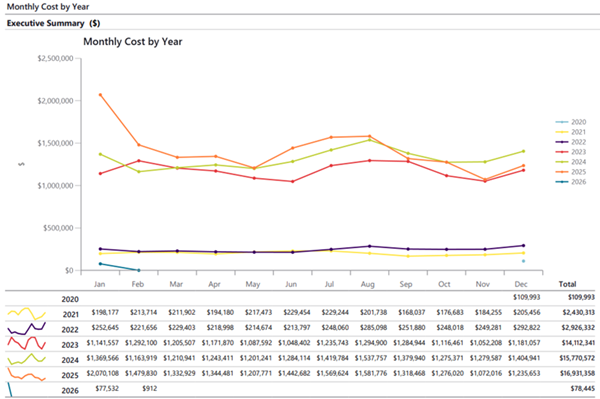
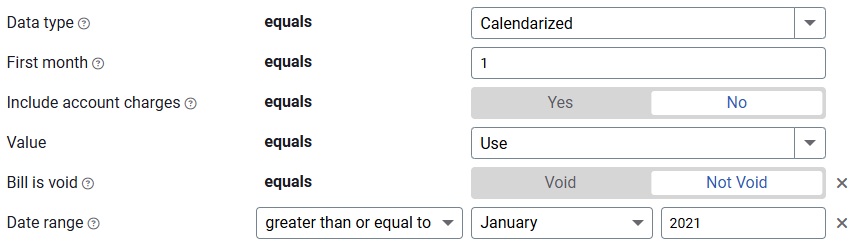
Example Report-01 shows calendarized use data for the entire organization for all years after 2021. Each colored line represents a year. This is a one-page executive report.
Example 2 filter settings
- Data type = calendarized
- First month = 1
- Include account charges = No
- Value = Use
- Bill is void = Not Void
- Date range >= January 2021
Report-01 vs Report-08
These reports may look similar, but they focus on different comparisons:
- Report-01 compares multiple years for one object. Example: A site's total commodity cost by month for 2015 to 2020.
- Report-08 compares multiple objects by month for one year. Example: Several sites' monthly commodity cost for 2020.
Report-01 recommendations
- You must include a time period, either a date range or accounting period.

- When you use the filter "between" with negative numbers, remember to enter the smaller value first.

- When you are reporting on Cost Avoidance, remember to run Cost Avoidance > Calculate Savings first.

- If you use the Chargebacks module, remember to use the appropriate Topmost place or Topmost cost center to prevent double counting use or cost.
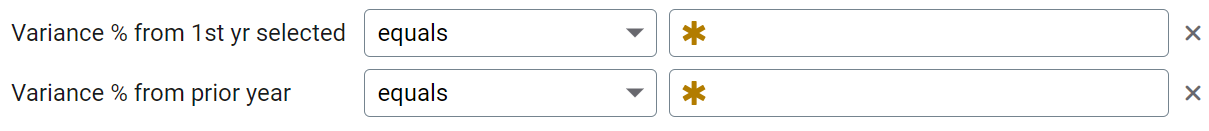
Report-01 variance threshold
Set a variance threshold to have the report automatically highlight abnormal results in the data table. When you use "equals," only those specific lines are highlighted—consider using "greater than" or "less than" to highlight any rows greater or less than the specified amount.
- Variance % from 1st year selected—compares each year to the selected year.
- Variance % from prior year—compares each year to the prior year.
Set your Report-01 filters
In the Data type field, choose the data set you want to use for the report.
| Data set | When to use it | Why it helps |
|---|---|---|
| Billing Period | Accounting, chargebacks, or any task that needs the exact bill dates | Uses the raw start and end dates from the utility bill |
| Calendarized | Month-to-month or year-over-year analysis of cost and usage | Spreads each bill across true calendar months so totals line up with financial periods. Displays both use and cost. |
| Normalized | Year-over-year usage analysis | Adjusts energy use for weather, removing temperature as a variable |
First month—Choose the month to start your report.
Include account charges—Decide whether to include one-time or periodic charges. These are not linked to use or demand on the bill.
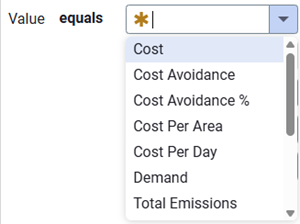
Value—Select what you want to report on for Report-01.
Time period—Use the Date range filter to set the reporting period. Or choose Accounting period—only available when using Billing period data.
If you stop here, you have a one-page summary report for your entire organization or your assigned topmost permissions.
Other filters to consider for Report-01
1. What are you reporting on?
Decide your report focus: building, meter, cost center, etc.
- One building—Set Topmost place to the specific building.
- Multiple buildings—Set Topmost place to the organization.
- Meters—Use the Meter group filter.
- One or more cost centers—Use the Topmost cost center filter.
2. Report format: one page or multi-page?
Use the Group by filter to control the layout:
- No Group by filter—One-page executive summary.
- Group by site (with topmost = organization)—One chart and data table per site.
3. Commodities
- To include all commodities, skip this filter.
- To include one or more commodities, use the Commodity category filter for more detailed charts and data.
4. Account status
- To include only active accounts, apply the Active account filter.
- Without it, the report includes both active and inactive accounts.
5. Void bills—Decide whether to include or exclude void bills in your report.
6. Chargebacks or vendor bills
Use the Bill is from external vendor filter:
- Select Yes to show only vendor bills.
- Select No to show only chargeback bills.
- Do not include the filter to show both vendor and chargeback bills.
Available filters for Report-01
Required filters
- Data type—Can be calendarized, billing period, or normalized.
- First month—Select the first calendar month for the report.
- Include account charges—Account charges are separate from meter charges and not used in calculating unit cost (for example, late fees, connection charges, or deposits).
- Value—Possible values include: Cost, Cost Avoidance, Cost Avoidance %, Cost Per Area, Cost Per Day, Demand, Total Emissions, Unit Cost, Use, Use Avoidance, Use Avoidance %, Use Per Area, Use Per Day.
Recommended filters
- Accounting period—When you use the Accounting period filter, you must set Data type to billing period data.
- Date range—For Report-01 you must select either an accounting period or a date range. The date range operator can be: less than, between, greater than, less than or equal to, greater than or equal to, prior year, prior fiscal year, prior 12 months (includes current month), prior 12 months (excludes current month), year-to-date (including current month), year-to-date (excluding current month), fiscal year-to-date (including current month), fiscal year-to-date (excluding current month).
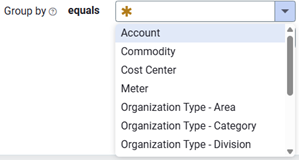
- Group by—Without this filter, Report-01 is a one-page summary report showing the total for the organization or topmost selected. The Group by filter can be: account, commodity, cost center, meter, organization types, site types, sites, vendors.
- Include a chart—Use this filter to include a data chart with the report.
- Meter group—Filter for specific groups. To include all group members, do not set a topmost filter. You can combine with other filters to refine your results.
- Site group—Filter for specific groups. To include all group members, do not set a topmost filter. You can combine with other filters to refine your results.
- Topmost cost center code—Select the topmost cost center you want to include. When you set a topmost cost center, it is the highest level of the accounting tree used. This lets you select a subset of data for reporting.
- Topmost cost center name—Select the topmost cost center you want to include. When you set a topmost cost center, it is the highest level of the accounting tree used. This lets you select a subset of data for reporting.
- Topmost place code—Select the topmost organization or site you want to include. When you set a topmost organization or site, it is the highest level of the facilities tree used. This lets you select a subset of data from your tree for reporting.
- Topmost place name—Select the topmost organization or site you want to include. When you set a topmost organization or site, it is the highest level of the facilities tree used. This lets you select a subset of data from your tree for reporting.
- Variance % from 1st year selected—Enter a numeric value. This option compares each year to the first year in the report. TIP: Consider using "greater than" to automatically highlight months that exceed the variance number you entered.
- Variance % from prior year—Enter a numeric value. This option compares each year to the prior year. TIP: Consider using "greater than" to automatically highlight months that exceed the variance you entered.
Optional filters
- Account is active—If this filter is not included, both active and inactive accounts are included in the report.
- Account name—Filter for one or more accounts. Use caution when combining with topmost or group filters.
- Account number—Filter for one or more accounts. Use caution when combining with topmost or group filters.
- Accounts in cost center code—Filter to include accounts directly under one or more cost centers. To see all accounts at a certain level in your hierarchy, use the Topmost cost center filter. Use caution when combining with other topmost or group filters.
- Accounts in cost center name—Filter to include accounts directly under one or more cost centers. To see all accounts at a certain level in your hierarchy, use the Topmost cost center filter. Use caution when combining with other topmost or group filters.
- Bill is from external vendor—If not selected, includes data from both vendor and chargeback (internal) bills.
- Bill is void—If this filter is not included, both void and not void bills are included.
- Commodity—Select one or more commodities. This filter is not compatible with the commodity category filter.
- Commodity category—Groups commodities into broader categories such as Electric or Gas. Use when you want to roll up all commodities within a category rather than selecting individual ones. Not compatible with the Commodity filter.
- Include accrual bills—If this filter is not included, the report includes accrual bills.
- Meter code—Filter to one or more meters. Use caution when combining with topmost filters.
- Meter group category—Filters to include all the meters in all the groups for the selected category.
- Meter name—Filter to include one or more meters. Use caution when combining with topmost or group filters.
- Meters in site code—Filter to include meters directly under one or more sites. To see all meters at a certain level in your hierarchy, use the Topmost place filter. Use caution when combining with other topmost or group filters.
- Meters in site name—Filter to include meters directly under one or more sites. To see all meters at a certain level in your hierarchy, use the Topmost place filter. Use caution when combining with other topmost or group filters.
- Vendor code—Filter by one or more vendors. To see all vendors, do not include a topmost or group filter. You can combine with other filters to refine your results.
- Vendor name—Filter by one or more vendors. To see all vendors, do not include a topmost or group filter. You can combine with other filters to refine your results.
Configured Report-01 options
Report-01 is flexible and has many configuration options. To help you be successful, several configured reports are available. Each report has its own preset filters and instructions.
