Report-01
Last updated February 24, 2026
Monthly Trends—Comparing Year-to-Year - EXEC
This is a configured version of Report-01 that is an executive summary of calendarized costs for your entire organization (or your assigned topmost).
Report-01: Executive Summary
The Executive Summary report provides a high-level comparison of performance over time. It compares the same object across multiple years so you can quickly identify trends and changes.
You can report on:
- Cost
- Use
- Demand
- Other available value types
You may also limit the report to a single commodity, such as electric, gas, or water, if needed.
The time frame is flexible. You can select any date range, and the report will compare the selected period across multiple years.
The report scope is fully configurable. You can run it for:
- The entire organization
- A selected portion of the hierarchy
- A specific property or meter
- A specific account
- A specific vendor
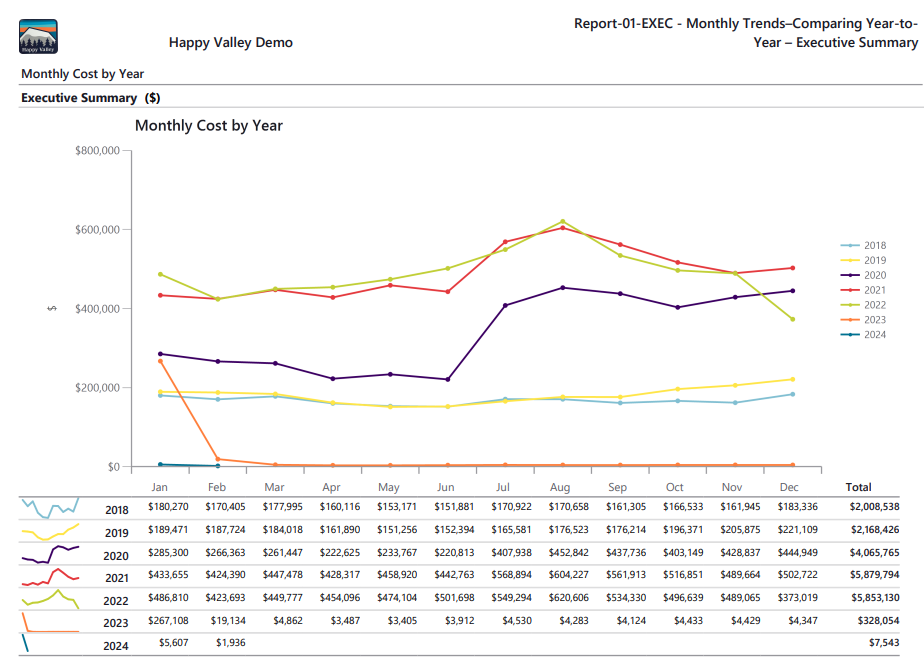
The report includes a line chart with monthly data for multiple years. Each year is shown as a separate trend line, which makes it easy to compare the same month across different years.
A data table at the bottom of the report displays the detailed monthly values that support the chart.
You can apply variance filters to highlight unusual changes or exceptions in the data table. This helps draw attention to significant increases or decreases.
This report is useful for:
- Spotting long-term trends
- Tracking savings over time
- Identifying seasonal patterns
- Investigating unexpected changes
You can use it at a high organizational level or drill down to a specific object for detailed year-over-year analysis.
Report-01-EXEC tip
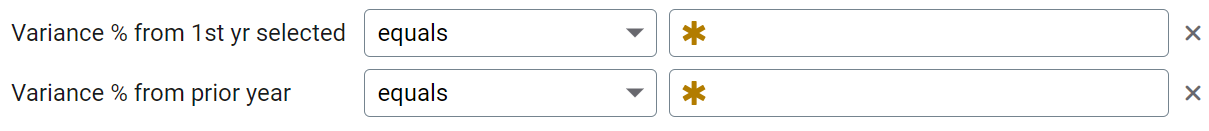
Set a variance threshold and have the report automatically highlight abnormal results in the data table. When you use equals, only those specific lines are highlighted. Consider using greater than or less than to highlight any rows greater or less than the specified amount.
- Variance % from 1st year selected - compares each year to the selected year
- Variance % from prior year - compares each year to the prior year
Other filters to consider for Report-01-EXEC
- Do you want to include all the Commodities, one, or a select few? If you don't add this filter, all the commodities are in your report. Use the Commodity category filter to view more granular commodity data in charts and reports.
- Do you want to include only Active accounts? If this filter is not included your report includes both active and inactive.
- Include or not include void bills?
- Do you use the Chargebacks module and only want to see vendor bills? Or only see chargeback bills? Add the filter Bill is from external vendor, otherwise you see both chargebacks and vendor bills in your report.