Report-04
Last updated May 11, 2026
Summary by Commodity
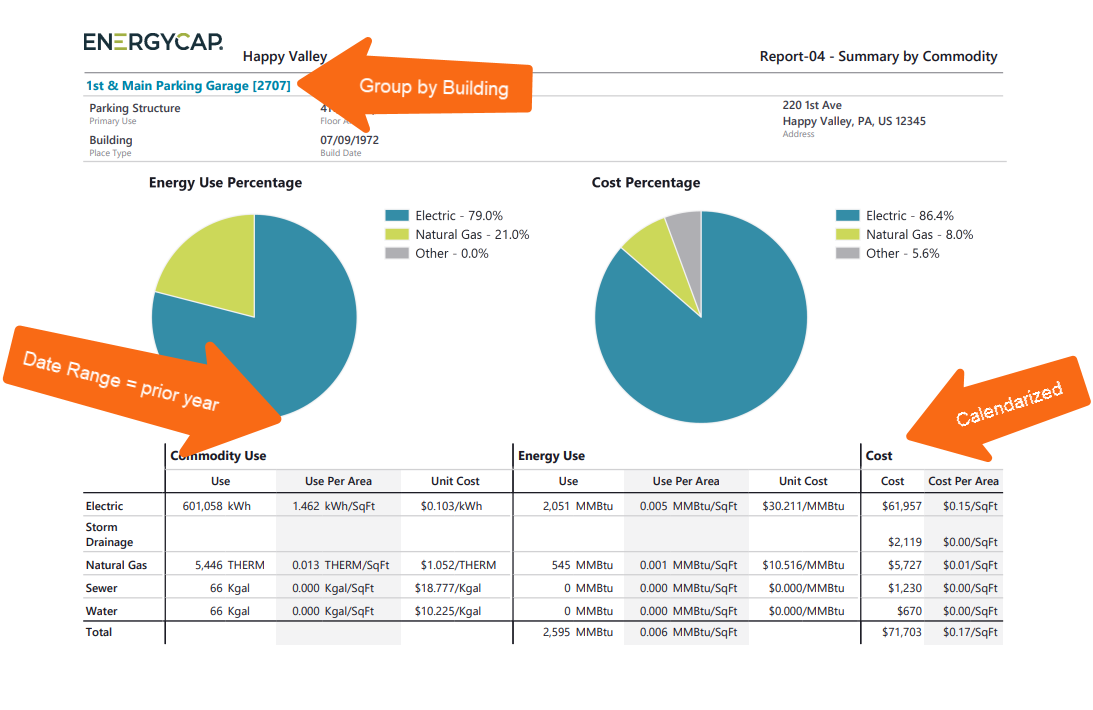
Report-04 shows utility use, cost, and unit cost by commodity. The report includes a data table and pie charts that break down results by commodity.
Use the Group by filter to generate one page per object instead of a single summary page.
What the report shows
- Commodity use and unit cost
- Energy use and unit cost
- Total cost for each commodity
- Two pie charts that display:
- Energy use percentage by commodity
- Cost percentage by commodity
Report versions
- One page executive summary – Displays all data on a single page. (No Group by filter.)
- One page per object – Displays a separate page for each selected object. (Group by filter applied.)
Report sections
The report includes two main sections:
- Pie charts – Provide a visual summary of how each commodity contributes to total usage and cost.
- Data table – Shows the detailed values for each commodity.
How this report helps
Use this report to:
- Understand how different utilities contribute to overall consumption and spending
- Identify commodities with the largest impact
- Compare use and cost at a glance
For example, if electricity accounts for 70% of total cost, you may focus on budgeting or efficiency projects related to electricity use.
Example uses without the Group by filter
- Report on total use and cost by commodity for your organization within a selected date range.
- Report on total use and cost by commodity for a specific cost center, site, or organization within a selected date range.
Example uses with the Group by filter
- Report on total use, use per area, and unit cost by site for the previous fiscal year.
- Report on total use, cost, and unit cost by cost center for the last three years.
Available formats
Report-04 is available as: PDF, Excel, Word
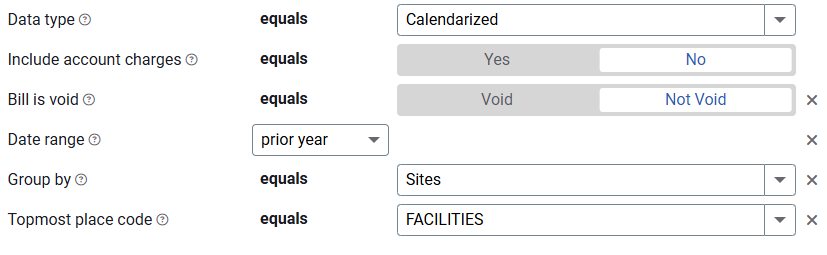
Filters used to create the sample report shown above.
Report-04 recommendations
- The Date range is typically a prior 12-month calendar or fiscal year.
- If you use chargebacks, remember to use the appropriate Topmost place or Topmost cost center to avoid double counting use or cost.
Set your filters for Report-04
- In the Data type field, choose the data set you want to use for the report.
Data set When to use it Why it helps Billing Period Accounting, chargebacks, or any task that needs the exact bill dates Uses the raw start and end dates from the utility bill Calendarized Month-to-month or year-over-year analysis of cost and usage Spreads each bill across true calendar months so totals line up with financial periods. Displays both use and cost. Normalized Year-over-year usage analysis Adjusts energy use for weather, removing temperature as a variable - Include account charges
Decide whether to include one-time or periodic charges.
These are not linked to use or demand on the bill. - Date range or Accounting period
If not set all billing period data is included. - Limit the report to a subset of data
Set a filter such as Topmost place, Site group, or Commodity.
Other filters to consider for Report-04
- Commodity category
Use this filter to view granular commodity data.
Helps break down charts and tables by specific utility types. - Active accounts only
Decide whether to include only active accounts.
If this filter is not applied, your report includes both active and inactive accounts. - Void bills
Include if you want a full audit history.
Exclude to focus only on valid financial activity. - Group by
Controls how many pages are in your report.- No Group by filter = One page executive summary.
- Topmost place = One chart or table per cost center, site, organization, or meter.
- Topmost place
When set to a specific organization, and paired with Group by site, the report shows one chart or table per site under that organization.
Available filters for Report-04
Required filters for Report-04
- Data type - You can select calendarized, billing period, or normalized.
- Include account charges - Account charges are separate from meter charges and not used in calculating unit cost. (For example, late fees, connection charges, or deposits)
Recommended filters for Report-04
- Accounting period - For Report-04 if you don't select an accounting period or billing period, all billing periods are included.
- Date range - For Report-04 if you don't select a billing period, all billing periods are included.
- Display by category - Select yes or no.
- Meter group - Lets you filter the report to a specific group of meters.
- Site group - Lets you filter the report to a specific group of sites.
- Topmost cost center code - When you use this filter you are selecting the topmost cost center you want to be included. When you set a topmost cost center it is the highest level of the accounting tree used, this lets you select a subset of data for reporting.
- Topmost cost center name - When you use this filter you are selecting the topmost cost center you want to be included. When you set a topmost cost center it is the highest level of the accounting tree used, this lets you select a subset of data for reporting.
- Topmost place code - Select the topmost organization or site you want to be included. When you set a topmost organization or site it is the highest level of the facilities tree used, this lets you select a subset of data from your tree for reporting.
- Topmost place name - Select the topmost organization or site you want to be included. When you set a topmost organization or site it is the highest level of the facilities tree used, this lets you select a subset of data from your tree for reporting.
Optional filters for Report-04
- Account is active - If this filter is not included, both active and inactive accounts are included in the report.
- Account name - Filter for one or more accounts. This filter is not compatible with topmost or group filters.
- Account number - Filter for one or more accounts. This filter is not compatible with topmost or group filters.
- Accounts in cost center code - Filter to include accounts directly under one or more cost centers. To see all the accounts at a certain level in your hierarchy use the Topmost cost center filter. This filter is not compatible with other topmost or group filters.
- Accounts in cost center name - Filter to include accounts directly under one or more cost centers. To see all the accounts at a certain level in your hierarchy use the Topmost cost center filter. This filter is not compatible with other topmost or group filters.
- Bill ID - Filter for specific bills, to include all the bills do not set a topmost or group filter. You can combine with other filters if you want to refine your results.
- Bill is from external vendor - When this filter is not selected, the report includes data from both vendor (external) and chargeback (internal) bills.
- Bill is void - If this filter is not included both void and not void are included.
- Commodity - Select one or more commodities to include in the report.
- Group by - By default this is a one page executive summary. Select Sites to create a multiple page report with one site per page. For Report-04 you can group by cost center, organization type, site type, and sites.
- Include accrual bills - If this filter is not included the report includes accrual bills.
- Meters in site code - Filter to include meters directly under one or more sites. To see all the meters at a certain level in your hierarchy use the topmost place filter. This filter is not compatible with other topmost or group filters.
- Meters in site name - Filter to include meters directly under one or more sites. To see all the meters at a certain level in your hierarchy use the topmost place filter. This filter is not compatible with other topmost or group filters.
- Vendor code - Filter by one or more vendors, to see all vendors do not include a topmost or group filter. You can combine with other filters if you want to refine your results.
- Vendor name - Filter by one or more vendors, to see all vendors do not include a topmost or group filter. You can combine with other filters if you want to refine your results.
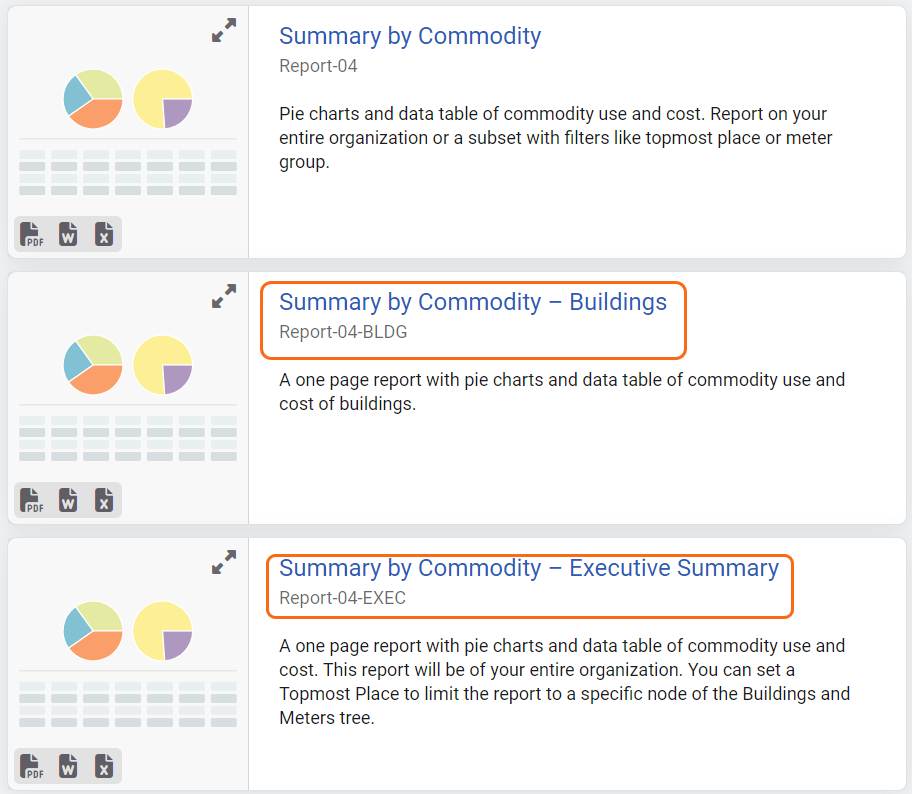
Configured Report-04 options
Report-04 is flexible and has many options available to configure. To help you be successful, several configured reports are available to get you started.
Each report version has its own preset filters and instructions.