Interval Data overview
Last updated July 9, 2026
are only available with the Interval Data add-on.
For Legacy Smart Analytics (formerly Wattics) help go here.
Interval data captures energy usage at frequent, recurring time intervals—such as every 15 minutes or every hour—rather than as monthly totals. This granular view allows you to:
- Analyze usage patterns throughout the day
- Compare weekday vs. weekend consumption
- Identify peak demand periods
- Detect operational inefficiencies and energy waste
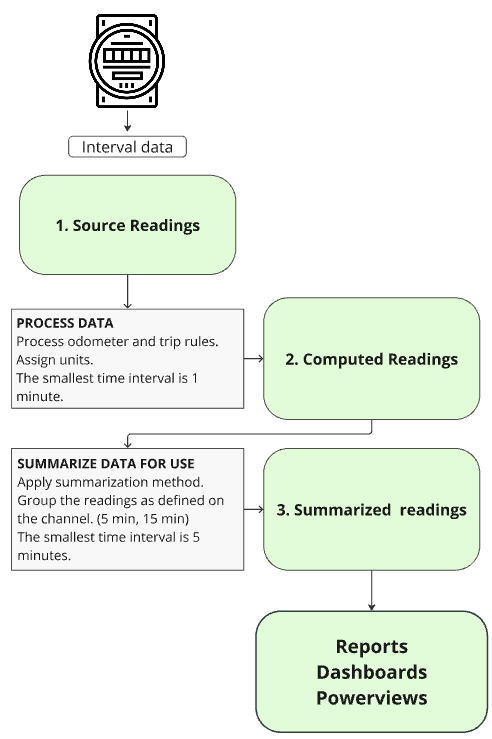
There are three types of readings in EnergyCAP:
- Source Readings
Unprocessed by EnergyCAP. - Computed Readings
Computed readings have rules and units applied. These readings are not snapped to the clock. The smallest time interval is one minute. - Summarized Readings
The summarization method is applied to the computed readings in each time interval. The smallest time interval is 5 minutes.
Summarized readings are snapped to the clock. For example, readings are grouped as defined on the channel (5 minute, 15 minute, etc.) and are assigned to the time interval that was defined. For example, a 15-minute channel has readings at 8:15, 8:30, 8:45.
Summarized readings are used for reports, Powerviews, Trend Insights, and in dashboard widgets.
Interval data can uncover
- Operational inefficiencies
- Energy waste and savings opportunities
- Peak demand and cost management
- Security and scheduling issues
- Equipment running outside scheduled hours
- Unexpected spikes in usage
Demand and cost management
Understanding when and how energy is used allows you to:
- Reduce peak demand charges
- Shift usage to lower-cost time periods
- Develop targeted cost-saving strategies
Interval data vs. utility bills
Utility bills provide monthly totals. Interval data provides continuous, time-based detail. Using both together gives a complete picture of energy usage and cost drivers.
| Utility bills | Interval data |
| Monthly totals | Time-based detail (e.g., 15-minute, hourly) |
| Useful for cost reporting and budgeting | Useful for operational analysis and demand management |
| Shows what you spent | Shows when and how energy was used |
How to view interval data
- Interval Data tab of the meter or site
- Dashboards
What you can do with interval data
EnergyCAP makes it easy to collect, analyze, and monitor your interval data across facilities. You can:
- Connect and collect data from meters, submeters, files, or APIs
- Analyze and backfill missing or incomplete data
- Monitor and alert on abnormal readings or data gaps
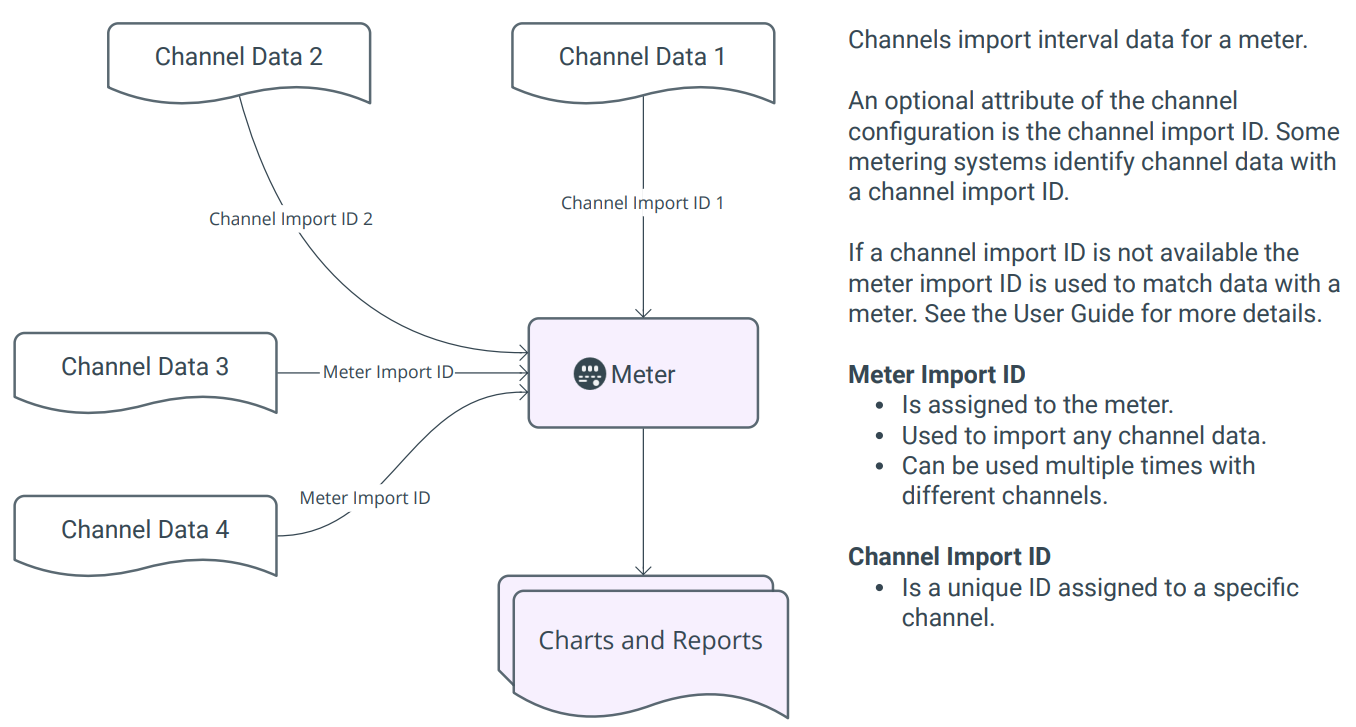
Review channels and make updates
Use Update setup spreadsheets to review and make updates to channel information.
Use cases
Organizations use interval data to:
- Detect equipment or scheduling issues
- Monitor building performance in near real time
- Identify energy waste such as overnight or weekend usage
- Support tenant billing or chargebacks
- Improve operational efficiency across facilities
Best practices
- Regularly review interval data for anomalies
- Use schedules to validate expected usage patterns
- Monitor demand peaks to control costs
- Combine interval data with billing data for a full picture
- Leverage calculated meters for deeper cross-meter analysis
Interval Data module
The Interval Data module helps you manage and monitor your interval meter readings. It includes these screens:
- Interval Data Meter Status
View interval data meters grouped by their last reading from the primary value channel. Helps to quickly spot potential issues with meters and readings. You can also see each meter's Trend Insights status here and use the Actions button to turn Trend Insights on or off in bulk.
Each channel also shows a Data Completeness percentage, which compares available summarized readings from the last 30 complete days against the number expected based on the channel's interval. Completeness levels:
- Good (above 95%)
- Fair (above 85% to 95%)
- Poor (85% or below)
- Insufficient Data (fewer than 30 days of data available). - Reading Imports
See a list of all imported reading files and their results. Includes links to:
- The imported file
- The readings
- The error file (if applicable) - Reading Import Profiles
View all the reading import profiles in your system.
From this screen, you can:
- Edit existing profiles
- Create a new import profile