Trend Insights
Last updated June 11, 2026
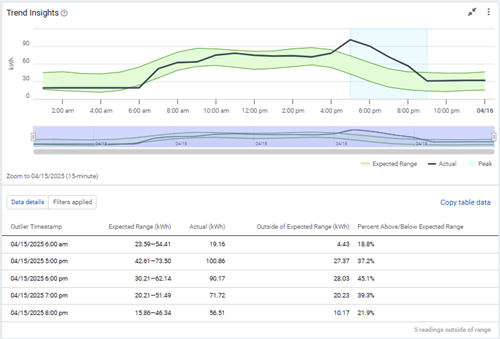
Trend Insights shows actual meter data from your primary value channel or demand channel, alongside a forecasted range based on historical patterns. The forecast becomes more accurate over time as the system gathers more readings.
This feature helps you detect use or demand trends and is available for meters with supported data.
What you see with Trend Insights
When Trend Insights is active, the graph displays:
- Actual readings from your primary value or primary demand channel.
- A shaded forecast range based on historical data shows the lower and upper bounds of the expected forecast.
- A single schedule overlaid on the graph (if applied).
When Trend Insights is available
Trend Insights appears only when the meter meets these requirements:
- The channel uses the sum summarization method.
- The channel interval is 1 hour or less.
- The data is consistent and includes enough history.
Turn Trend Insights on or off
You can disable Trend Insights when forecasts seem inaccurate or the data is too erratic.
- To turn off Trend Insights for a single meter
1. Go to the meter's Interval Data tab.
2. Select the Trend Insights Powerview secondary tab.
3. Use the toggle to turn it off. - To manage multiple meters at one time
Open the Interval Data Meter Status page. The Trend Insights column shows each meter's current status (On or Off). Select one or more meters and use the Actions button to turn Trend Insights on or off for the selected meters.
Notifications for out-of-range data
You can receive notifications when actual readings fall outside the forecasted range. This helps you spot unexpected use or system issues.
Note: Turning off Trend Insights at the meter level also stops Trend Insight notifications for that meter.