Interval Data overview
Last updated February 12, 2026
Interval data provides a more granular view of use and demand.
Interval data can uncover
- Equipment cycling on and off.
- Daily startup schedule begins too early.
- The daily set back schedule begins too late.
- Costly concurrent peak demand issues.
- Inefficient custodial crew scheduling.
- Weekend and holiday setback or shutdown savings opportunities.
- Utility theft.
- Wasteful HVAC control procedures.
How to view interval data
- Interval Data tab of the meter
- Dashboards
- Reports
- Daily report with up to 8 days with data overlay of the previous week.
- Smart meter daily max report overlays multiple weeks to spot trends and anomalies.
Channels
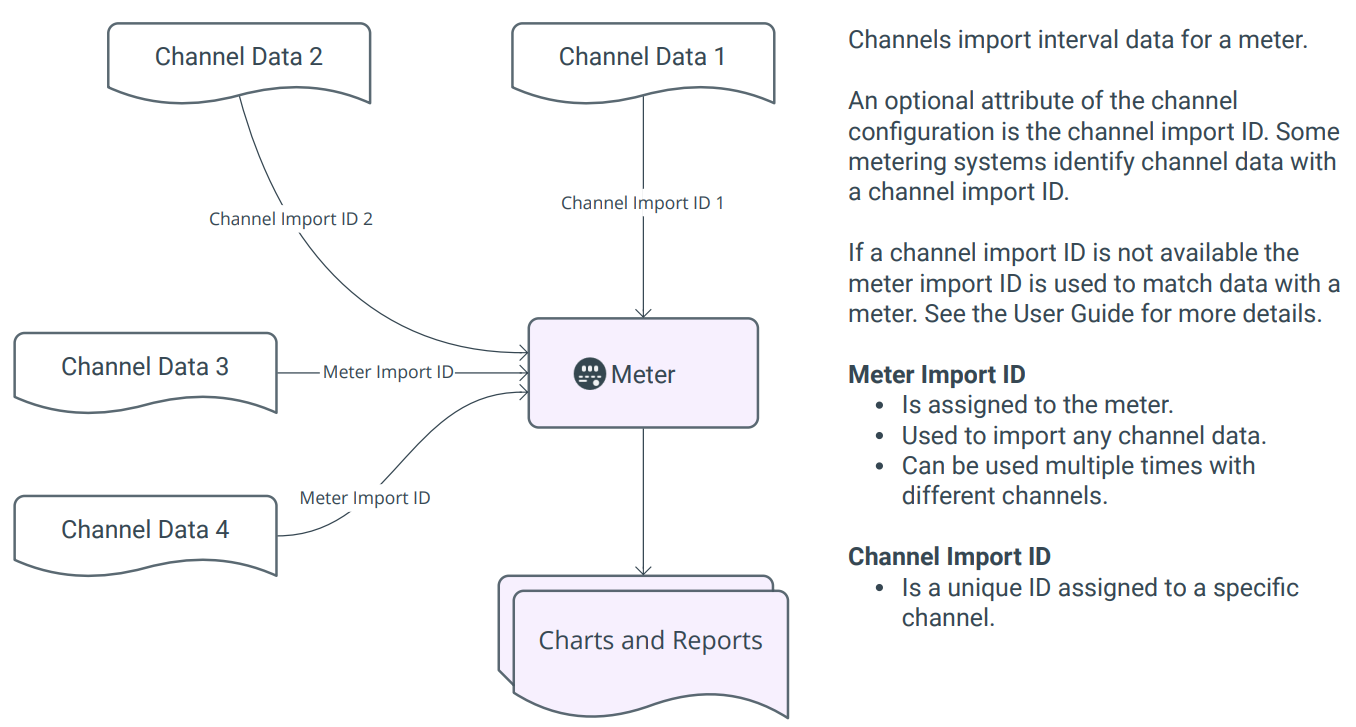
Channels import interval data for a meter. Channel data can be used to generate chargeback bills.
Each meter can have multiple channels to import different types of interval data.
Default intervals available
- 15-minute
- 30-minute
- Hourly
- Daily
- Weekly
- Monthly
Each meter can have multiple channels configured for different types of interval data. Channels are created through spreadsheets or in the application before importing interval data.
Custom fields for channels
Custom fields for channels let you track specific items for your submeters. You can update the values in the application or with a spreadsheet.
Channel import ID
Some metering systems identify channel data with a channel import ID. In UtilityManagement the channel import ID is a unique value in the database.
Example of meter import ID vs channel import ID, note each channel import ID is unique.
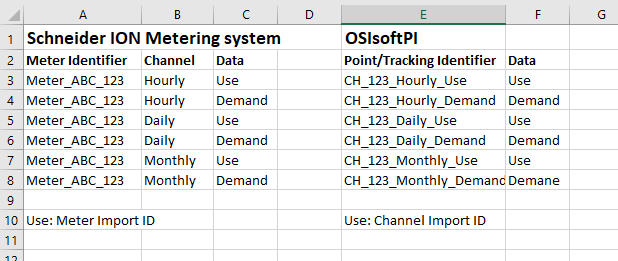
Meter import ID
A meter import ID is assigned to the meter and is used by many different channels to import meter readings for a meter.
How is data imported when there is one meter import ID and multiple channels?
When a Meter Import ID is used, EnergyCAP uses additional details to identify the correct channel during import:
The system combines:
- Meter Import ID
- Interval (15-minute, hourly, daily)
- Interval data type (for example, use, demand, cost)
This combination ensures each data row is matched to the correct channel.
Example
If a meter has both a 15-minute use and 15-minute demand channels, the interval data type distinguishes between them.
Channel review and updates
Update setup spreadsheets let you review and make updates to channel information.
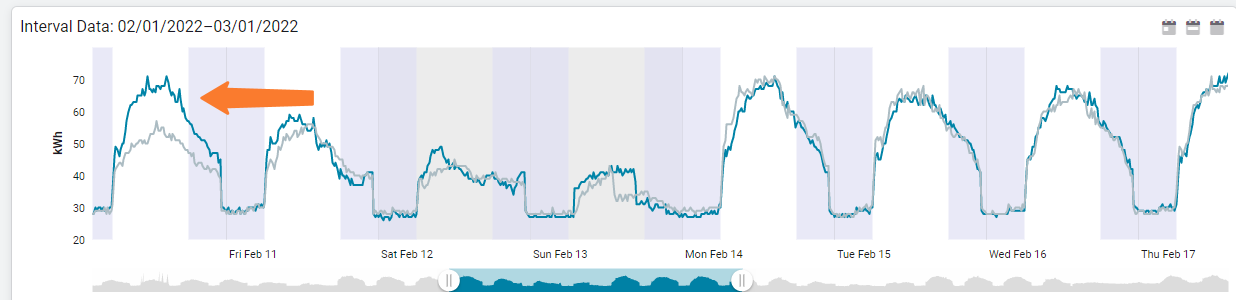
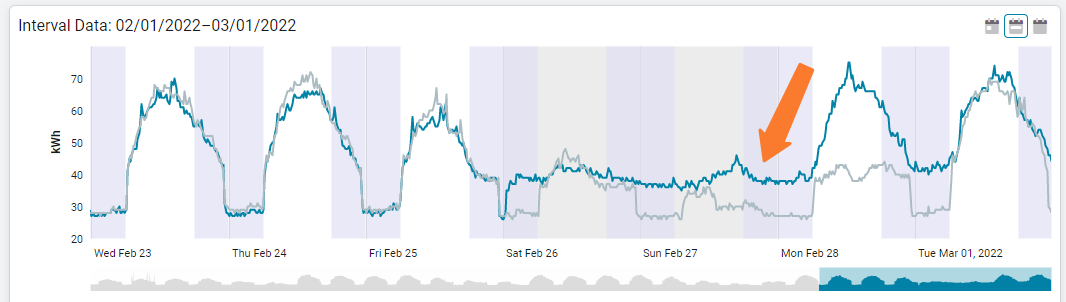
Sample interval data charts
Why is the electrical load elevated for the entire weekend compared to the previous week?
Spikes in use need to be investigated.

The blue line is the current week and the gray line is the previous week. What caused an increase of use on this day?