EnergyCAP 8.2 release notes
Integrate Wattics with EnergyCAP!
Wattics—EnergyCAP’s real-time energy analytics solution—monitors the performance of devices and assets to help you make quick, data-driven operations decisions.
When you are an EnergyCAP and Wattics customer you can now link the two together.
EnergyCAP Home
EnergyCAP Home helps you manage your users and access your applications.
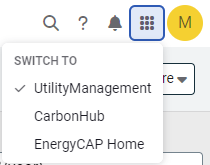
After you login it's easy to switch between applications or go back to EnergyCAP Home.
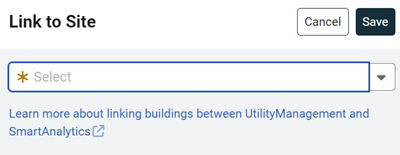
Link EnergyCAP buildings to Wattics sites
When you link EnergyCAP and Wattics you can quickly navigate between the applications. Simply select your EnergyCAP building and use the Actions menu to link to a Wattics site.
Link EnergyCAP meters to Wattics data points
Just like linking sites, you can link an EnergyCAP meter to a Wattics data point from either application.
New tags let you quickly move between applications
Linked buildings and meters have a tag that lets you quickly switch to the corresponding object in Wattics.
![]()
Use Wattics interval data in bill calculations
When you link to a Wattics data point you can use the interval data in bill calculations for use and demand.
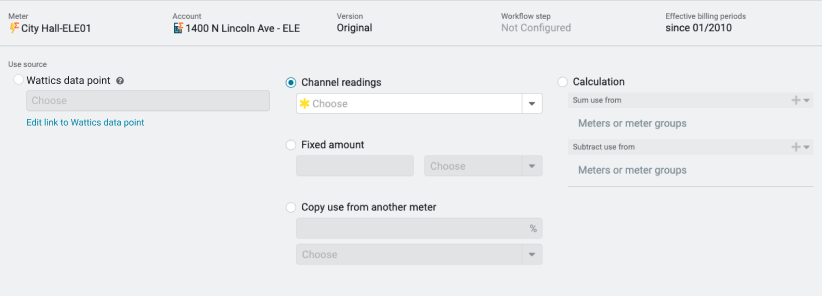
You can configure your bill calculation to use a Wattics data point in either the application or through a setup spreadsheet.
Maps
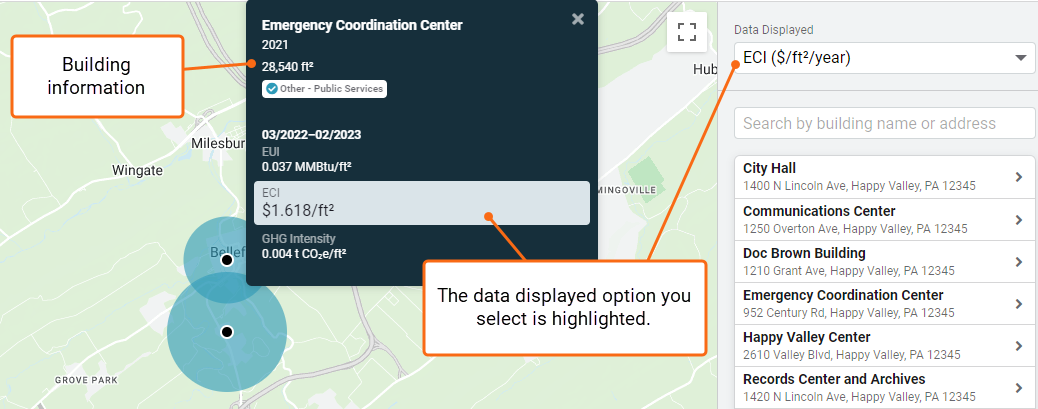
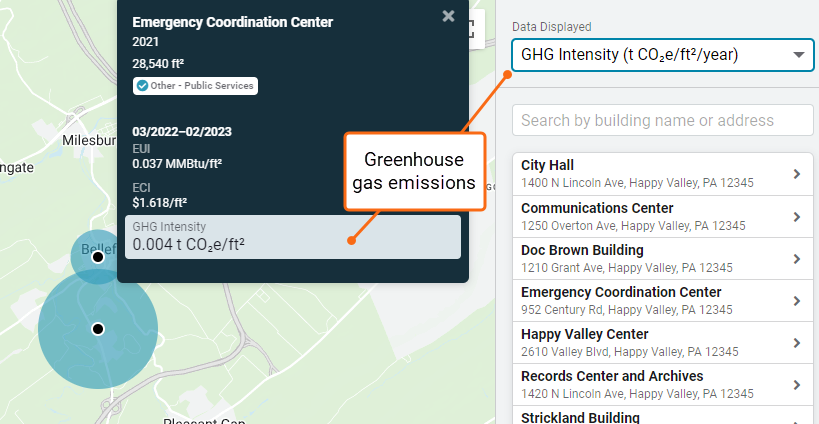
Use the building tooltip to see more details
When you hover over the black dot representing a building, the tooltip displays more data. You can quickly view building information and see the specific building data used to draw the map.
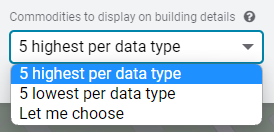
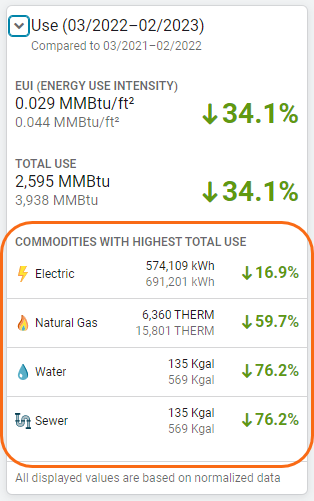
Configure how to view commodity information
You can choose how to display commodity metrics—highest to lowest or lowest to highest—or you can select the specific commodities you prefer to see.
*This selection does not impact the building totals.
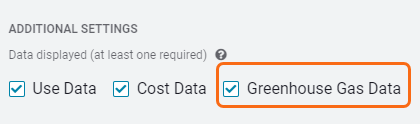
GHG details for Carbon Hub subscribers
When you are a Carbon Hub customer you can make Greenhouse gas data available to map viewers.
Dashboards
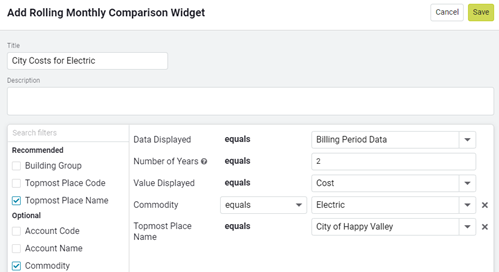
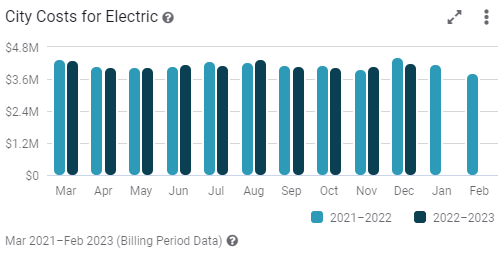
New Rolling Monthly Comparison widget
This new widget lets you compare the most recent two years of data by month.
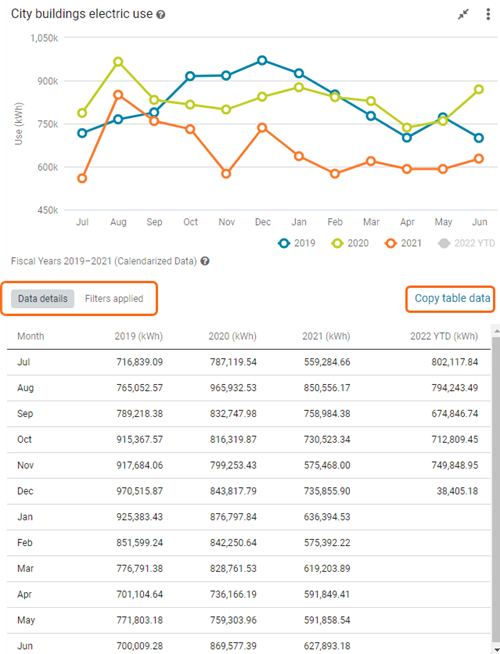
Updates to Monthly Use Trend widget
We've added new filters and updated the look of this dashboard widget. It's easy to expand and see the details behind the chart, view the filters applied, or copy the data table.