Settings menu
Last updated June 24, 2026
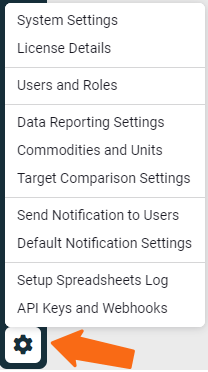
The Settings menu (or Gear icon) is where you can configure many different settings for the EnergyCAP application.
General
System Settings
The General System settings dialog lets you set the following:
- Organization name
- Organization logo
- Automatic logout after a specified number of minutes
- Default country
- Default time zone
- Date format for new users
- Default user role for new users
- Default topmost place for new users
- Default topmost cost center for new users
- Default topmost collection for new users
- Bill Pay cutover date
Organization name
An organization name is required and is populated during implementation.
You can add an organization logo and a preview is provided after you add a correctly sized logo.
Organization logo
An organizational logo must be at least 96 pixels wide by 96 pixels high, be 5MB or smaller and be a PNG, JPEG, or SVG. The image width cannot be more than two times the image height.
Default user role for new users
The Default user role for new users setting applies to all new users, including those created automatically through SSO.
You can change a user’s role during setup or after the user is created.
Default topmost place, cost center, and collection
When users are automatically created by a single sign-on session, this topmost setting is assigned. This is the highest level that the user can access.
This setting is also the default when creating users. The default assignment can be changed by an administrator either during creation or after the user is created.
Subscription Details
Subscription details provides your validation code and information about licensed meters and modules.
All meters, both active and inactive, count towards your total licensed meters. This screen lists the total number of meters in use and the total number of purchased meters.
The Subscription Details screen displays:
- The number of meters purchased
- Modules purchased (special add-ons)
- CAPture Services statistics
Users
Users and roles
Manage users, user groups, and roles with the Users and Roles option. There is no limit to the number of users you can add. Your subscription costs are determined by the number of meters you purchase.
You can add active users one at a time or multiple users at one time with setup spreadsheets.
When a user is made inactive they are automatically logged out of EnergyCAP.
Add new roles or download a User Roles and Permissions spreadsheet on the Roles & Permissions tab.
Data and Reporting
Data Reporting Settings
Data Reporting Settings lets you configure the units to use throughout the application.
Energy use
Energy use units let you add together unlike energy resources for reporting. The meter use unit is always used for meter reporting.
Cost
This sets your system currency, this is used by default in bills and records. You can override this setting if needed when viewing bills and records.
*Currency conversion uses https://openexchangerates.org/
Area
Decide how you want floor area displayed.
Exclude months from charts
This option lets you exclude data from the last full specified months from charts in dashboards. For example, when the current month is September and last 2 months is selected, September, August, and July are excluded from charts.
This setting does not apply to dashboard charts set to a specific date range or any reports.
Commodities and Units
Here you can configure your global reporting unit, (you can think of this as your energy reporting unit), the common rollup unit for each commodity, (think of this as your commodity reporting unit) and manage your commodity categories.
These settings should be modified by an administrator who understands the outcome of making unit changes. This powerful feature makes system-wide updates.
Commodity Categories
This section lets you group your commodities. This is useful because it gives you more granularity when reporting on overall use and costs. It separates commodities into their individual sources in Powerviews and reports.
You can create, customize and delete categories at any time. Four categories are populated with commodities for you.
- Electricity
- Water
- Sewer
- Travel
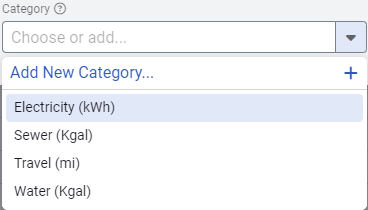
After you create a new commodity category, click on the commodity you want to add, and then use the Category drop-down to assign it to a category.
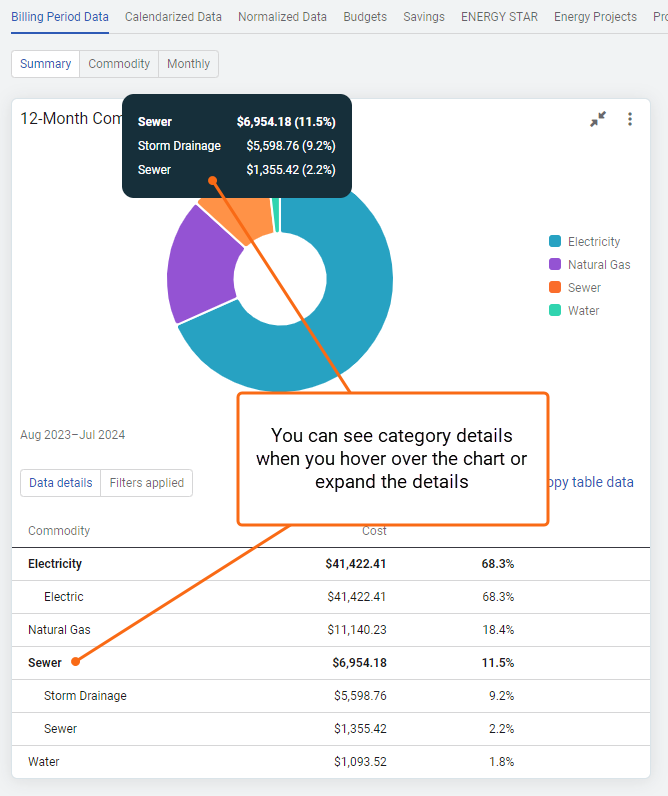
View commodity category details
You can view the commodity details when you expand the Powerview or hover over the chart.
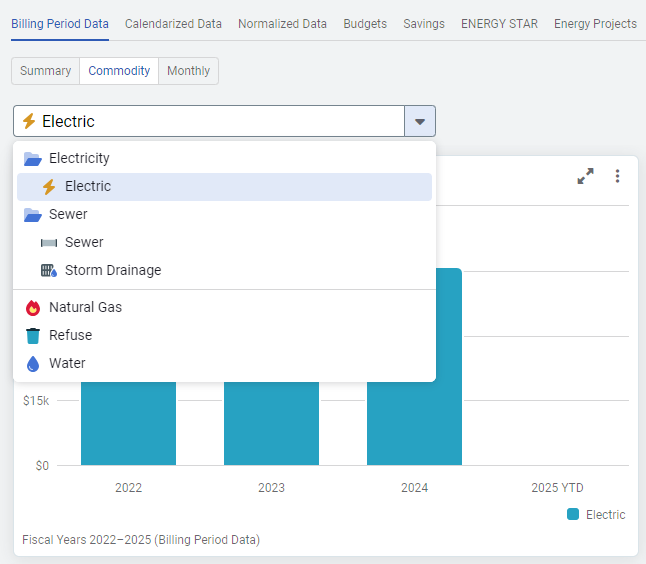
You can view Commodity Powerviews by individual commodity or by commodity category.
Cost Categories
With this option you can customize the default cost categories. These are visible in charts when you use the filter - Group by cost category.
The first step is to review and, if needed, update the default category labels.
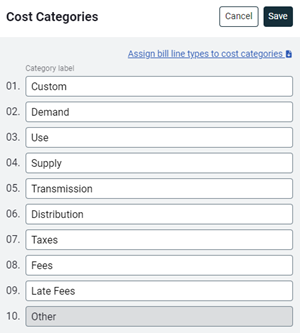
After you have configured the categories, you can download the spreadsheet and update the assigned bill line types to cost categories and then upload your file.
It will take up to 24 hours for category changes to be processed.
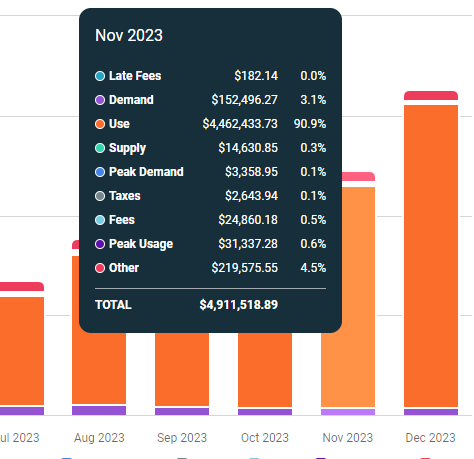
You can see your Cost Categories in the Trend Chart and Rolling Month Comparison widget. Include the Group by filter and select Cost Category. You can hover over the stacked bar or expand the widget to see more details.
Accounting Settings
This lets you configure your fiscal year, calendarization method, and accounting period names.
Target Comparison Settings
Target comparison places a target line on organization, site, and meter level charts based on a selected billing year.
You can configure the target line in the Settings menu (Gear icon) or in the Sites and Meters module menu.
All the details are here.
Emissions
Default Categories and Factors
This section lets you configure the type, default scope category, and the default factor. You can also decide if you want to create emissions sources from new meters with commodities that have assigned scope categories and factors.
Custom Factors
Use a setup spreadsheet to update custom factors.
Notifications
Send Notification to Users
Send Notification to Users is an option to quickly send a message to one or more user groups. By default, administrators can send notifications, this permission can be added to custom roles.
Default Notification Settings
In the Setting menu, administrators can configure the default notifications settings for users.
Administrators can:
- Set the default notification settings for new users.
- Disable the ability of users to receive email notifications.
Integrations and Logs
Setup Spreadsheets Log
All uploaded files and results are logged. The Setup Spreadsheet Log is user specific and only someone with the Administrator: Full Access role can view all the uploaded files.
API Keys and Webhooks
API keys provide third-party application developers a means of accessing EnergyCAP data.
Webhooks are HTTP callbacks used to trigger custom code and actions when EnergyCAP data is changed.