Sites and Meters module overview
Last updated July 6, 2026
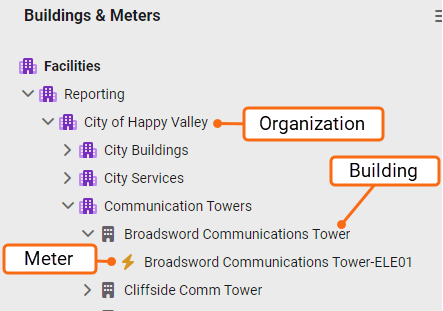
The Sites and Meters module is the primary workspace for managing your sites and the meters that track their energy use. It organizes your data into a hierarchy of organizations, sites, and meters—making it easy to view energy use and costs at any level, from an individual meter up to your entire organization.
This structure is used by Building Operations and Energy Management teams to monitor consumption, identify trends, and drill down into the data that matters most.
Structure and purpose
Organizations
- Group related sites (for example, departments, campuses, business units).
- Enable subtotal views of:
- Energy use
- Costs
- Trends across all included sites and meters.
- Can be used in filters.
- Assigning a top-level organization to a user restricts their access to only that branch of the facilities tree.
Sites
- Shown under an organization.
- Represent a physical location or logical place (for example, a building, floor, or zone).
- Act as the parent to one or more meters.
Meters
- Are assigned to a site.
- Track use and cost for a specific commodity (for example, electricity, water, gas).
How to organize sites
Organize sites in a way that support your reporting needs and reflect your organization's structure. A well-organized structure improves visibility, analysis, and access control.
Here’s a clear and concise guide on how to organize sites in EnergyCAP, ideal for documentation or training:
Common organization methods
- By Reporting or Management Hierarchy
Group sites based on how your facilities are managed or how you need to report data.
• Example: Operations → Buildings → Meters - By Physical Layout
Organize geographically to reflect physical locations.
• Example: All sites in Pennsylvania or West Campus - By Organizational Structure
Align with departments, regions, or divisions.
• Example: All sites under District 9 or Finance Department
User access control with site organization
- You can limit user access by assigning them to specific organizations or sites.
- Users can only view and report on data within their assigned branch of the facilities tree (often called the topmost place).
- This ensures secure and relevant access for different teams or roles.
You cannot edit your topmost place, cost center, or site. The root node or your topmost organization cannot be changed.
Module menu |
|
| Greenhouse Gases | |
| Link Meters to Emissions Sources | Download a spreadsheet to link meters to emissions sources. You can link any meter with emissions details to an emissions source. |
| Scope Category Information | View information on scope categories. |
| Cost Avoidance | |
| Cost Avoidance Calculations | Displays task results. |
| Update Settings for Existing Meters | Update settings for multiple meters at one time. Baseline and Savings are reprocessed and logged in Cost Avoidance Calculations. |
| New Meter Defaults | Cost Avoidance global settings determine the default values applied when meters are created. Changes to the default settings DO NOT affect existing meters. |
| Average Unit Cost (AUC) Range | Set the lower and upper allowable AUC limits. |
| Services and Tools | |
|
Interval Data Import |
Import multiple meter readings for one or more meters. |
|
Interval Data Import Formats |
The import format maps the file columns in the source file to the specific data types in EnergyCAP. |
| Site Forecast Worksheet | An Excel spreadsheet generated from historical billing data to help you create a utility budget. This worksheet uses calendarized data from one year that you specify to forecast use and cost. You can modify this as needed but this worksheet cannot be uploaded into the application. |
| Budgets | If you have the Budgets feature. Otherwise only the Site Forecast Worksheet is available. |
| ENERGY STAR | |
| Settings | To turn on ENERGY STAR settings for your database add one or more email recipients and set the earliest submission month. |
| Submit to ENERGY STAR | Set your filters to select data to submit to ENERGY STAR. |
| Activity | ENERGY STAR activity log. |
| Supported Commodities | This lists the ENERGY STAR supported commodities for your database. |
| Settings | |
|
Normalization |
Normalization applies the same weather to all utility bills allowing you to compare energy use from year to year. This removes weather as a variable in analyzing energy conservation measures. |
|
Target Comparison |
A target comparison places a target line in charts based on a previous billing year. |
| Custom Benchmarks | Create three additional methods for grouping and ranking your sites. |
|
Custom Fields for Sites |
Create and edit custom fields. Custom fields are useful for creating groups. |
|
Custom Fields for Meters |
Create and edit custom fields. Custom fields are useful for creating groups. |
| Custom Fields for Channels | Create and edit custom fields. |
| Hierarchy | This selection determines how your Sites and Meters tree is displayed. |
| List by Hierarchy | Display your tree by hierarchy. |
| List by Meter Group | Display your tree by meter group. |
|
The display options let you view your tree objects by their name, code, or both the name and code. The tree is listed in alphabetical order, as a result each display option lists the tree objects in a different order.
|
|
|
Display Name |
Shows just the name. |
|
Display Code |
Shows just the code. |
|
Display Name [Code] |
Shows name followed by code. |
|
Display Code [Name] |
Show code followed by name. |
|
Show Inactive Meters |
Show or hide inactive meters. |
Permissions
A roles and permissions audit report is available for download on the Users and Roles page. The report lists each role and the permissions assigned to it. It does not include per-user login timestamps or user activity data.
Custom user roles are created by administrators.